
- Press release
- 4 April 2019
Euro area quarterly balance of payments and international investment position: fourth quarter of 2018
- Current account surplus at €335 billion (2.9% of euro area GDP) in 2018, down from €363 billion (3.2% of GDP) in 2017
- Geographic counterparts: largest bilateral surpluses vis-à-vis United Kingdom (€151 billion, down from €169 billion in 2017) and United States (€130 billion, up from €86 billion), with largest deficit vis-à-vis China (€69 billion, down from €75 billion)
- International investment position at end-2018 showed net liabilities of €437 billion (around 4% of euro area GDP), after €509 billion at end of third quarter 2018
Current account
The current account surplus of the euro area declined to €335 billion (2.9% of euro area GDP) in 2018, from a surplus of €363 billion (3.2% of euro area GDP) in 2017 (see Table 1). This decrease mainly reflected a smaller surplus for goods (declining from €318 billion to €276 billion) and – to a lesser extent – a larger deficit for secondary income (increasing from €137 billion to €149 billion). These developments were partly offset by increases in the surpluses for primary income (from €78 billion to €101 billion) and services (from €104 billion to €107 billion).
The increase in the primary income surplus was mainly due to larger surpluses in portfolio debt income (increasing from €18 billion to €27 billion) and other primary income (from €9 billion to €14 billion), the latter mostly related to transactions with the EU institutions.
The small increase in the services surplus resulted mainly from a larger surplus for telecommunication, computer and information services (from €70 billion to €82 billion) which was partly offset by a decline in the surplus for insurance, pension and financial services (from €18 billion to €14 billion) and by an increase in the deficit for other business services (from €12 billion to €15 billion).
Current account of the euro area
(EUR billions, unless otherwise indicated; transactions during the period; non-working day and non-seasonally adjusted)
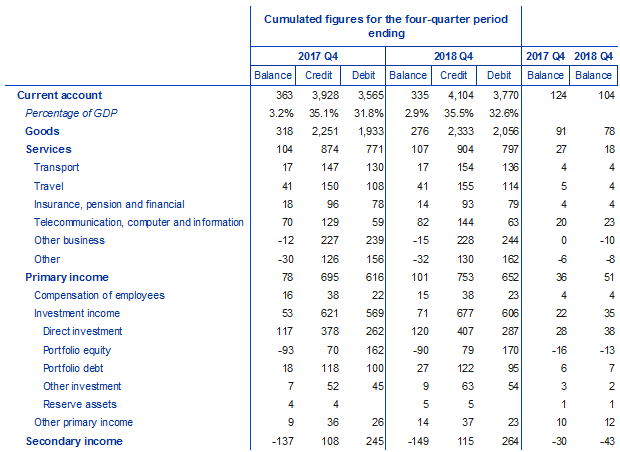
Source: ECBNote: “Equity” comprises equity and investment fund shares. Discrepancies between totals and their components may arise from rounding.
Data on the geographic counterparts of the euro area current account (see Chart 1) show that in 2018 the euro area recorded its largest surpluses vis-à-vis the United Kingdom (€151 billion, declining from €169 billion in 2017), the United States (€130 billion, increasing from €86 billion), a residual group of other countries (€83 billion, declining from €143 billion) and Switzerland (€56 billion, increasing from €53 billion). The largest bilateral deficit in the euro area current account was recorded vis-à-vis China (€69 billion, declining from €75 billion).
The most significant geographic change in the components of the euro area current account balance in 2018 was a drop in the goods balance vis-à-vis other countries (to a deficit of €25 billion in 2018 from a surplus of €43 billion in 2017), which was partly driven by an increase of €16 billion in the deficit vis-à-vis Russia. Moreover, the goods surplus vis-à-vis the United States increased from €129 billion to €149 billion. The primary income surplus vis-à-vis the United Kingdom declined from €17 billion to €4 billion, while this balance switched from a deficit of €8 billion to a surplus of €4 billion vis-à-vis the United States. The secondary income deficit vis-à-vis the rest of the EU (excluding the United Kingdom) increased to €87 billion in 2018 from €72 billion, driven by an increase in net contributions to the EU budget.
Geographical breakdown of the euro area current account balance
(Four-quarter moving sums in EUR billions; non-seasonally adjusted)
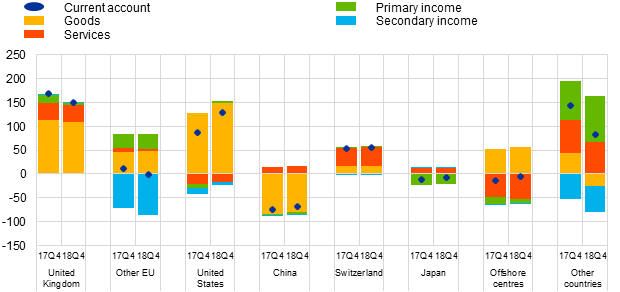
Source: ECB.Notes: “Other EU” comprises EU Member States and EU institutions outside the euro area excluding the United Kingdom. “Other countries” includes all countries and country groups not shown in the chart as well as unallocated transactions.
International investment position
At the end of 2018 the international investment position of the euro area showed net liabilities of €437 billion vis-à-vis the rest of the world (around 4% of euro area GDP), compared with net liabilities of €509 billion at the end of the third quarter of 2018 (see Chart 2 and Table 2).
Net international investment position of the euro area
(Net outstanding amounts at end of period as a percentage of four-quarter moving sums of GDP)
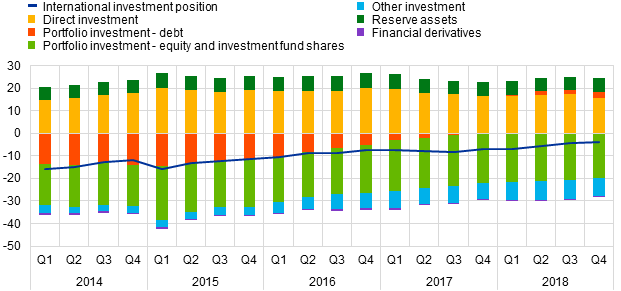
Source: ECB.
This improvement of €72 billion mainly reflected higher net assets in portfolio debt (€342 billion, up from €210 billion) and lower net liabilities in portfolio equity (€2,299 billion, down from €2,393 billion). These developments were partly offset by lower net assets in direct investment (€1,785 billion, down from €1,997 billion).
International investment position of the euro area
(EUR billions, unless otherwise indicated; amounts outstanding at the end of the period, flows during the period; non-working day and non-seasonally adjusted)
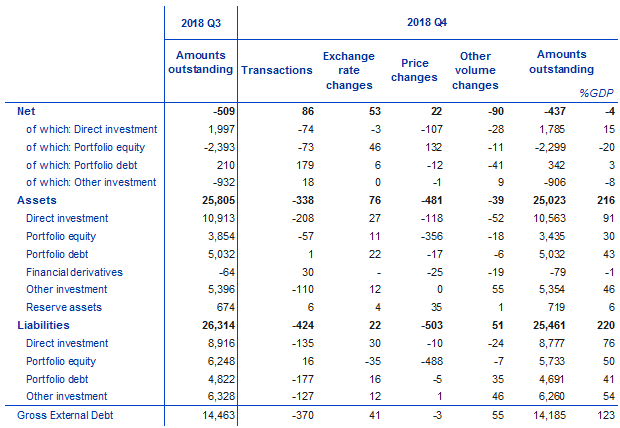
Source: ECB.Note: “Equity” comprises equity and investment fund shares. Net financial derivatives are reported under assets. Discrepancies between totals and their components may arise from rounding.
The improvement in the euro area’s net international investment position in the fourth quarter of 2018 was mainly driven by transactions as well as positive net exchange rate and price changes, which were partly offset by negative net other volume changes (see Chart 3).
Net assets in portfolio debt increased primarily due to transactions (see Table 2), while lower net liabilities in portfolio equity resulted mainly from positive net revaluations. The latter was driven by the decline in euro area and global stock markets in the fourth quarter of 2018, which led to somewhat larger negative price changes for euro area portfolio equity liabilities (€488 billion) than for assets (€356 billion). Direct investment net assets decreased mainly due to negative net price changes and transactions.
At the end of 2018 the gross external debt of the euro area amounted to €14.2 trillion (around 123% of euro area GDP), which represents a decrease of €278 billion compared with the third quarter of 2018.
Changes in the net international investment position of the euro area
(EUR billions; flows during the period)
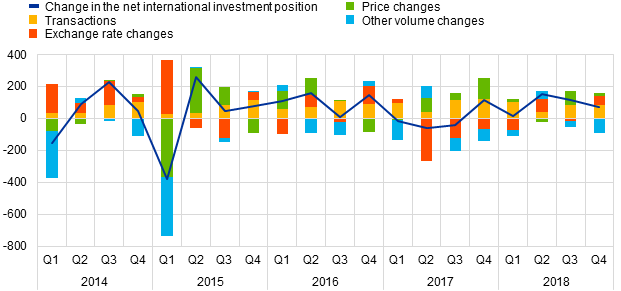
Source: ECB.Notes: Other volume changes mainly reflect reclassifications and data enhancements.
At the end of 2018 the stock of euro area direct investment assets was €10.6 trillion, 25% of which was invested in the United States and 20% in the United Kingdom (see Table 3). The stock of foreign direct investment liabilities was €8.8 trillion, with 26% being investment by residents of the United States and 24% by offshore financial centres.
In portfolio investment, euro area holdings of foreign securities amounted to €3.4 trillion in equity and to €5.0 trillion in debt at the end of 2018. In equity and debt, the largest issuing countries of these securities were the United States (accounting for 42% and 33% respectively) and the United Kingdom (11% and 18% respectively). On the liabilities side, non-residents’ holdings of securities issued by euro area residents stood at €5.7 trillion in equity and at €4.7 trillion in debt at the end of 2018. Newly available estimates show that the largest holder countries of euro area equity securities were the United States (39%) and United Kingdom (12%), while in euro area debt securities the largest holders were the BRIC group of countries (15%), Japan (15%) and the United States (14%).
In other investment, euro area residents’ claims on non-residents amounted to €5.4 trillion, 33% of which was vis-à-vis residents of the United Kingdom and 19% vis-à-vis residents of the United States. Euro area other investment liabilities amounted to €6.3 trillion, with residents of the United Kingdom and the rest of the EU accounting for 32% and 17% respectively.
International investment position of the euro area – geographical breakdown
(As a percentage of the total, unless otherwise indicated; positions during the period; non-working day and non-seasonally adjusted)
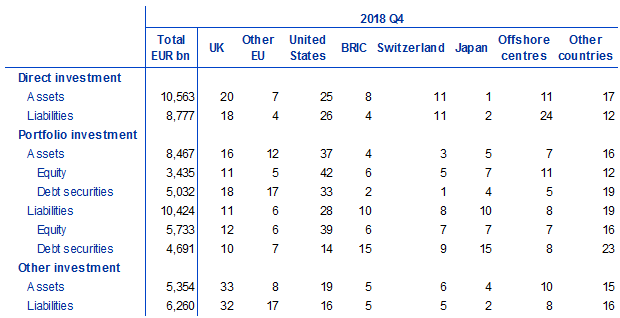
Source: ECB. Note: “Equity” comprises equity and investment fund shares. “Other EU” comprises EU Member States and EU institutions outside the euro area excluding the United Kingdom. The “BRIC” countries are Brazil, Russia, India and China. “Other countries” includes all countries and country groups not listed in the table as well as unallocated positions.
Data revisions
This press release incorporates revisions to the data for all reference periods between the first quarter of 2015 and the third quarter of 2018. The revisions to direct investment and portfolio investment were particularly sizeable and reflect revised national contributions to the euro area aggregates, in particular for the Netherlands and Luxembourg as a result of newly available information being incorporated.
Next press releases
- Monthly balance of payments: 17 April 2019 (reference data up to February 2019)
- Quarterly balance of payments and international investment position: 3 July 2019 (reference data up to the first quarter of 2019)
For media queries, please contact Philippe Rispal, tel.: +49 69 1344 5482.
Notes
- All data are neither seasonally nor working day-adjusted. Ratios to GDP (including in the charts) refer to four-quarter sums of non-seasonally and non-working day-adjusted GDP figures.
- Hyperlinks in this press release lead to data that may change with subsequent releases as a result of revisions.
European Central Bank
Directorate General Communications
- Sonnemannstrasse 20
- 60314 Frankfurt am Main, Germany
- +49 69 1344 7455
- media@ecb.europa.eu
Reproduction is permitted provided that the source is acknowledged.
Media contacts