

Trust in the ECB – insights from the Consumer Expectations Survey
Published as part of the ECB Economic Bulletin, Issue 3/2024.
1 Introduction
Trust in the ECB among euro area residents is important for the efficacy of the ECB’s monetary policy. The euro itself relies on the trust of its users, as is the case with any fiat currency, and increased trust in the ECB has been shown to better anchor inflation expectations.[1] Trust is thus integral to the effective conduct of monetary policy. However, multiple global crises and increased global uncertainty since the start of the pandemic, coupled with elevated inflation over the last two years, have put central banks in the spotlight. An in-depth understanding of the state of trust in the ECB is thus particularly relevant.
The ECB monitors trust in the institution mainly through surveys. A prominent metric for assessing trust is the European Commission’s Standard Eurobarometer, which has been surveying European citizens with a focus on their opinions on the ECB since 1999. It asks whether respondents “tend to trust” or “tend not to trust” the ECB, and hence provides binary response options.[2]
Since 2020 the ECB has been conducting its Consumer Expectations Survey (CES), which primarily asks euro area residents about their economic circumstances and expectations for the future, but also asks about their trust in the ECB.[3] While the evolution of trust in the ECB is often analysed at an aggregate level (typically at national or euro area level), trust in the ECB has also been linked to a variety of sociodemographic factors and economic beliefs specific to individuals.[4] An in-depth analysis at the level of the individual respondent therefore has the potential to tell us more about the nature of trust and how aggregate dynamics reflect the characteristics of trust among individuals.
The granularity of the CES allows more detailed analysis than the Eurobarometer, especially at the level of the individual respondent. This article exploits three features of the CES to delve deeper into individual respondents’ perspectives on trust in the ECB. First, a scale of 0 to 10 for responses to the question on trust allows a differentiation to be made between individuals with levels of trust across a spectrum from one extreme to the other – providing for a greater granularity of responses than the corresponding question in the Eurobarometer. Second, the CES tracks the same individuals through multiple survey waves, while the Eurobarometer surveys new respondents in each wave.[5] This allows changes in trust to be traced over time at the level of individuals, rather than on aggregate only. Third, the CES also asks about trust not only in other EU institutions, but also in the respondent’s national central bank, while the Eurobarometer does not. The two surveys also differ in various other respects.[6] However, a direct comparison of the two surveys’ results also requires more years of data for the CES, which has only been running for four years.
Following a discussion of aggregate results for trust in the ECB in both the Eurobarometer and the CES, this article focuses specifically on insights that can be gained from the three features of the CES mentioned above.
2 Trust in the ECB since the start of the pandemic
On aggregate, according to the Eurobarometer, trust in the ECB held up relatively well during the pandemic and in the period of heightened inflation thereafter. Average trust across euro area countries declined significantly during the global financial crisis and the sovereign debt crisis, but slowly recovered afterwards (Chart 1). In the latest Eurobarometer survey, conducted in October and November 2023, 43% of euro area respondents expressed trust in the ECB, while 42% said they did not trust the institution and 15% answered that they did not know. Net trust in the ECB, defined as the percentage share of respondents that “tend to trust” the ECB minus the percentage share of respondents that “tend not to trust” the ECB, was thus marginally positive. After having increased from 2020 to mid-2021, it declined into negative territory in early 2022 and recovered to pre-pandemic levels thereafter.[7] This relative stability has persisted despite high inflation being cited as a main concern by survey respondents since 2021, as well as unprecedented global tensions.
Trust in the ECB, as measured through the CES since the introduction of the survey in 2020, has shown similar patterns. While methodological differences and its shorter survey sample preclude a direct comparison between the CES and surveys such as the Eurobarometer, there is co-movement of responses in the two surveys. With CES respondents being asked at a monthly frequency how much they trust the ECB on a scale of 0 to 10, average trust in the ECB is now close to its initial level at the start of the pandemic – just above the scale’s mid-point of 5. Average trust in the ECB showed a small increase from April 2020 to mid-2021, which occurred at the same time as a range of policy measures implemented following the onset of the pandemic, both by central banks such as the ECB and by other EU institutions and national governments. That increase in trust in the ECB was followed by a more gradual decline by the same amount as of mid-2021 (Chart 1), a period during which inflation increased to substantially above the 2% target and Russia’s invasion of Ukraine had a major impact on the euro area economy.
Chart 1
Trust in the ECB according to the Eurobarometer and the Consumer Expectations Survey
(left-hand scale: net trust in the ECB across euro area respondents (Eurobarometer), percentages; right-hand scale: average trust in the ECB (CES), scale of 0 to 10)

Sources: Standard Eurobarometer, ECB Consumer Expectations Survey and ECB calculations.
Notes: Standard Eurobarometer data cover survey waves 51 (spring 1999) to 100 (autumn 2023). Net trust is the percentage of respondents answering “tend to trust” minus the percentage answering “tend not to trust”. Respondents who answered “don’t know” are disregarded. CES data are a weighted average and cover monthly survey waves from April 2020 to December 2023. The CES trust question is answered on a scale of 0 to 10 (with 0 being no trust at all and 10 being complete trust).
Until now, analyses of trust in the ECB, in the absence of an adequate survey such as the CES, have not focused on the evolution of individuals’ trust over time. While insights generated from the CES should be interpreted with caution, as the survey so far covers only a few years, the CES allows some questions to be answered on the nature of trust in the ECB that cannot be answered by the Eurobarometer. In particular, the panel structure of the CES allows an analysis of whether the relative stability of trust over time at the aggregate level is also found at the individual level. Academic research has typically concentrated on differences in trust between various individuals at a single point in time, while policy analyses usually examine how trust evolves over time within large sociodemographic groups.[8] Nonetheless, the temporal aspect of an individual’s trust is significant for understanding overall trust, including how deeply rooted specific views about the ECB are.
Month on month, individuals typically exhibit only marginal changes, if any, in their trust in the ECB. Given the high frequency of the CES and the common view in the academic literature that trust in institutions is built gradually, respondents reconsider their level of trust only marginally from one monthly survey wave to the next.[9] Specifically, around one-third of respondents in each survey wave do not change their trust level at all, while a further third adjust it by only +/-1 (Chart 2).[10] Changes are generally distributed symmetrically, leading to only small aggregate month-on-month changes over time. The patterns observed in month-on-month changes in trust remain largely consistent across longer time horizons, such as quarterly or annual changes in trust of individuals.
Chart 2
Distribution of month-on-month changes in trust of individual respondents
(y-axis: change in trust level; shading: percentage shares of respondents)

Sources: ECB Consumer Expectations Survey and ECB calculations.
Notes: Weighted CES estimates covering monthly survey waves from April 2020 to December 2023. The cell shading reflects the share of respondents in a given survey wave (month) that changed their trust in the ECB vis-à-vis the previous month by the amount shown on the scale. A darker shade represents a larger share of respondents – for example, the highest share is seen in June 2022, when 38% of respondents reported an unchanged level of trust relative to the previous survey wave (month). For simplicity, month‑on‑month changes greater than +5 or -5 are not shown, as they reflect less than 5% of respondents in each wave. To avoid tenure effects, the chart is based on respondents completing the survey for a second (consecutive) time.
Variation in trust across the panel of CES respondents stems mainly from differences between respondents. With variation in trust of individuals over time being relatively limited, variation in trust across the entire sample primarily stems from differences between respondents, rather than changes in their individual responses. This is confirmed by a decomposition of the standard deviation of trust levels in the CES panel, revealing that variation in trust across respondents is twice as high as the variation for individual respondents over time.[11] In other words, while differences between respondents are relatively high, levels of trust for individual respondents are relatively stable.
3 Nuances in the degree of trust among respondents
The granular (0-10) scale of the CES allows a finer distinction between trust and the absence of trust than can be achieved with the Eurobarometer. As trust is often regarded as being built up incrementally over time, a granular scale is helpful to better analyse developments in trust, especially at the extremes, while binary trust variables mask such granular information.
CES microdata confirm that trust is a non-binary concept. The granularity of the answer scale of the CES shows that trust is not a matter of “yes” or “no”; rather, it exists on a spectrum (Chart 3). While average trust in the ECB stands above the scale’s mid-point over the entire sample, some individuals have a lot of trust in the ECB, others have some trust, and some have very little trust in the ECB, with these varying degrees of trust potentially leading to different attitudes and behaviours. On a scale of 0 to 10, most respondents have a trust level between 5 and 8. In the December 2023 survey wave, the left tail of this bimodal distribution was characterised by around 12% of respondents with no trust at all in the ECB, while a smaller share of respondents expressed complete trust.[12]
Chart 3
Distribution of trust values, December 2023
(x-axis: trust level; y-axis: percentage shares of respondents)

Sources: ECB Consumer Expectations Survey and ECB calculations.
Note: Weighted CES estimates covering survey waves from April 2020 to December 2023.
The aggregate distribution of expressions of trust is relatively stable over time. Despite going through a period of great uncertainty due to multiple crises over a short period of time, the distribution of trust values has remained stable (Chart 4). This reflects the stability of opinions at the individual level.
Chart 4
Distribution of trust over time
(y-axis: trust level; shading: percentage shares of respondents)
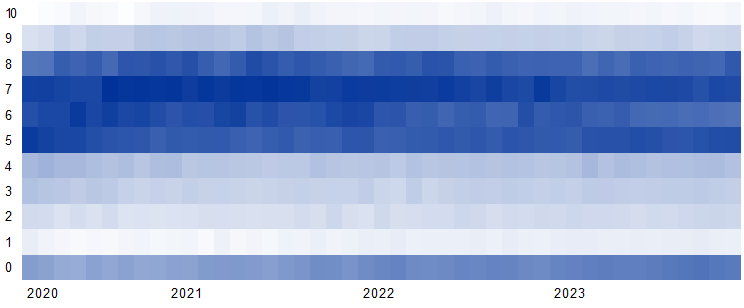
Sources: ECB Consumer Expectations Survey and ECB calculations.
Notes: Weighted CES estimates covering monthly survey waves from April 2020 to December 2023. The cell shading reflects the share of respondents in a given survey wave (month) that had the level of trust in the ECB shown on the scale. A darker shade represents a larger share of respondents – for example, the highest share is seen in September 2020, when 17% of respondents reported a trust level of 7.
A significant majority of survey respondents express either some trust or a high level of trust in the ECB, with those expressing a complete lack of trust remaining a relatively small group. The CES questionnaire informs respondents that a score of 10 means complete trust in the institution, while a score of 0 means no trust in the institution at all.[13] In practice, each respondent may attach their own interpretation to the different values on the scale. For example, an individual’s score of 0 might mean a complete absence of trust, but it could also reflect active distrust (“negative trust”). In fact, the relatively high share of respondents with a trust level of 0, relative to the trust level of 1, suggests that individual scores of 0 reflect more than one underlying sentiment. Thus, the distribution of trust levels is potentially left‑censored. Several studies point out that the concept of distrust is not the same as the absence of trust and that distrust might imply greater familiarity with what is being judged.[14]
The share of respondents with no trust in the ECB stood at around 9% at the inception of the survey – and increased slightly after inflation started to climb beyond 2% in mid-2021, reaching 12% in December 2023. While the average level of trust in the ECB increased slightly in 2020, and thereafter declined very gradually to its starting value by December 2023, the share of respondents with no trust has increased by around 3 percentage points since 2020. This share varies significantly across countries, but it gradually increased in most countries over the sample period. In some countries, it declined in 2022 and 2023, coinciding with the decline in inflation rates.
In general, respondents with no trust remain critical over longer time horizons. Over the relatively short sample period of the CES, almost 80% of individuals with no trust in the ECB in the previous survey wave are likely to also have no trust in the current wave (Chart 5, dark blue cell). Respondents with no trust in the ECB are also more likely to report the same level of trust in the following wave than respondents with complete trust.[15] Since the trust levels of individual respondents with no trust are thus fairly stable from one month to another, trust that reaches 0 may remain at that level for an extended period of time. This corroborates the finding that variation between individuals is a greater contributor to overall variation than variation for individuals over time. It will only be possible to determine whether this conclusion holds in the longer term, including in periods that are economically and geopolitically more benign, once the survey has a longer sample.
Chart 5
Month-on-month changes in trust level, by trust level in previous survey wave
(x-axis: previous trust level; y-axis: change in trust level; shading: percentage shares of respondents)

Sources: ECB Consumer Expectations Survey and ECB calculations.
Notes: Weighted CES estimates covering survey waves from April 2020 to December 2023. The cell shading reflects the share of respondents with a given change in trust in the ECB in the current survey wave relative to the previous survey wave. A darker shade represents a larger share of respondents – for example, the highest share in the chart is the 79% of respondents with a trust level of 0 in the previous wave who do not change their trust level in the current wave. For simplicity, month-on-month changes greater than +5 or -5 are not shown, as they reflect less than 5% of respondents.
Trust in the ECB appears to be associated with inflation expectations and other expectations regarding economic developments. Among respondents with no trust in the ECB, around 40% on average over the sample period expected prices to increase a lot over the following three years (Chart 6, panel a). In contrast, only around 20% of respondents with complete trust in the ECB expected prices to rise a lot.[16] Mean inflation expectations expressed in quantitative terms were also consistently higher among respondents with no trust in the ECB than among respondents with complete trust in the ECB. However, this gap is not stable over time and widens substantially in periods of higher inflation (Chart 6, panel b), which might imply that trust can, at least in the short term, anchor inflation expectations when an economic shock occurs, corroborating findings in the literature.[17] As well as lower inflation expectations, individuals with complete trust in the ECB also have lower expectations for unemployment and higher expectations for economic growth over the following 12 months.
Chart 6
Inflation expectations, by level of trust in the ECB
a) Shares of respondents with specific inflation expectations (qualitative)
(percentage shares of respondents)

b) Inflation expectations over time (quantitative)
(mean inflation expectations; annual percentage changes)

Sources: ECB Consumer Expectations Survey and ECB calculations.
Notes: Weighted CES estimates covering survey waves from April 2020 to December 2023. “No trust in the ECB” denotes a trust level of 0; “complete trust in the ECB” denotes a trust level of 10. The mean inflation expectations in panel b are winsorised at the 2nd and 98th percentiles for each survey round and country. The survey question on quantitative inflation expectations is open-ended.
Box 1
Who are the individuals at the extremes of the trust scale?
As Section 3 of this article explains, while the group of respondents with no trust in the ECB is relatively small, accounting for about 10% of survey participants across the sample, their perspective may offer valuable insights. This box therefore seeks to understand this group by comparing their socioeconomic characteristics with those of the respondents who have complete trust in the ECB.
Chart A presents the shares of respondents with complete trust and no trust in the ECB grouped by socioeconomic characteristics. It includes some of the time-invariant variables that academic studies have found to be related to trust in the ECB, like age, gender, education, household income and financial knowledge.[18] We also consider respondents’ perception of income inequality, as it is associated with mean trust and potentially reflective of a discontent that underlies the extremes of trust in the ECB.[19]
As regards age, the share of individuals with complete trust in the ECB is broadly stable across age groups, while the share of respondents with no trust in the ECB is particularly high in the 35-49 age group and smallest in the 65 and above age group.[20]
When it comes to gender, the percentage of respondents with complete trust is slightly higher for men than for women. However, for individuals with no trust in the ECB, it is the other way round. The literature so far is ambiguous on what effect gender tends to have on higher trust levels.[21]
Looking at formal education, the share of respondents with complete trust slightly increases with the level of education. In contrast, the share of individuals with no trust in the ECB is significantly lower for those with at least upper secondary education than for those with lower levels of education.
As regards income quintiles, the share of individuals in the highest trust group is greatest in the top income quintile, but the relationship is not linear. By contrast, there is a clear linear relationship between the relative size of the no trust group and the income quintile, with the share of respondents expressing no trust being greatest in the bottom income quintile.
An interesting picture emerges when looking at financial knowledge, as it seems inversely related to both having no trust and having complete trust in the ECB. This suggests that both extremes of trust in the ECB may reflect a lack of specific ECB-relevant knowledge.[22]
As regards perceptions of income inequality, the extremes of trust in the ECB seem to be related to extreme perceptions of income inequality. However, perceptions of very high inequality outweigh perceptions of very low inequality among individuals with no trust, while the reverse is the case for individuals with complete trust.[23]
Chart A
Shares of respondents with no trust and complete trust in the ECB, by socioeconomic characteristics
(percentage shares of respondents)

Sources: ECB Consumer Expectations Survey and ECB calculations.
Notes: Weighted CES estimates covering survey waves from April 2020 to December 2023. Financial knowledge is measured by the number of correct answers to survey questions on real interest rates, compounding of interest and risk diversification.
4 Trust in the ECB and trust in other institutions
Trust in the ECB appears to co-move with, or even reflect, trust in central banks and EU institutions more broadly. Within the universe of national and international policymaking institutions, the unique structure of the Eurosystem and the ECB’s mandate and objectives mean the ECB has characteristics in common with both national central banks and other European institutions. Particularly for respondents with less formal education, the distinction between institutions may not be clear, and may lead to a high correlation of trust for very different institutions (see also Box 2). Individuals may also show distrust in institutions in general, even when aware of their different mandates.[24] It is therefore important to understand the extent to which trust in the ECB is associated with trust in other institutions and the extent to which it is ECB-specific.[25]
CES data show a high correlation of trust across institutions. This is evident from trust levels (correlation rate of over 72% for all institution pairs when pooling all survey responses) and from month-on-month changes in trust (39%). This corroborates the findings of studies using the Eurobarometer survey. In fact, similar shares of respondents with no trust are observed for the European Parliament, the European Commission, the United Nations and national central banks – casting doubt on the interpretation of trust levels for any institution in isolation. These results are also supported by a simple principal component analysis (PCA).[26] In other words, trust in any of the institutions covered by the survey, including the United Nations with its global mandate, is highly correlated with trust in the ECB, with the same holding for changes in levels of trust. This has implications for the ECB, also in view of the elevated inflation rates during the sample period. If increased inflation rates and inflation expectations are associated with lower trust across different institutions, then respondents may be viewing all institutions as responsible and/or may be unaware of the mandates of individual institutions.[27] Similarly, trust in the ECB may also be affected by developments not related to its mandate. Indeed, it is likely that trust in the ECB is also strongly influenced by broader trust in – or the performance of – institutions as a whole and thus cannot be interpreted in isolation from other institutions.[28]
Principal component analysis suggests the presence of underlying associations with other EU institutions and central banks which have an impact on trust in the ECB. To simplify the interpretation of the components in a PCA which capture the variation in the original data, they can be rotated. These rotations are transformations of the original components which aim to achieve a simpler structure of loadings in order to more easily interpret patterns between variables.[29] These rotated components indicate that levels of trust in the ECB are influenced by broader trust developments for EU institutions and central banks (Chart 7). Component 1 puts a heavy loading on trust in the European Parliament (0.66) and the European Commission (0.65), and partially on trust in the ECB (0.37), suggesting the existence of an “EU factor”. Component 2 loads heavily on trust in the national central bank (0.90) and partially on trust in the ECB (0.44), indicating a “central bank factor”. A third component primarily relates to levels of, and changes in, trust in the United Nations (1.00).[30] This is tentative evidence of both a European dimension and a central banking dimension in the evolution of trust in the ECB.[31]
Chart 7
Principal component analysis of trust levels
Rotated (oblique) principal components
(loadings)

Sources: ECB Consumer Expectations Survey and ECB calculations.
Note: Weighted CES estimates covering survey waves from April 2020 to December 2023.
Box 2
Co-movement of trust in different institutions
Section 4 of this article documents the presence of high correlations across institutions, both in levels of trust and in changes in trust. In other words, respondents who trust the ECB more (less), tend to also trust other institutions more (less). This box seeks to understand the nature of this association between individuals’ trust in the ECB and their trust in other institutions. In particular, it asks whether correlations differ depending on the respondent’s level of trust and financial knowledge.
Correlations in individuals’ trust across institutions do not vary significantly over time.[32] Furthermore, on average, an individual’s level of trust in the ECB also corresponds to their level of trust in other (national and international) institutions in the CES.
The correlation of an individual’s levels of trust across institutions appears to be negatively associated with the level of trust in the ECB itself (Chart A, panel a).[33] The correlation is highest at very low trust levels, meaning that respondents with no trust in the ECB are more likely to have a similar level of trust in all other institutions, while a respondent with more trust in the ECB is more likely to have more differentiated views across institutions.[34]
Another interesting question is whether a higher level of formal education is related to an individual having levels of trust that are more strongly differentiated across institutions. Using the CES variable on level of education, we indeed find that an individual with higher formal education tends to differentiate more in their trust ratings for different institutions.
Overall, these results suggest that respondents appear to differentiate more in their assessment of different institutions when they have higher levels of formal education and when they have greater trust in the ECB.
Chart A
Association between individuals’ trust correlations and trust in the ECB and level of education
(average correlation between individuals’ trust in the ECB and trust in other institutions)

Sources: ECB Consumer Expectations Survey and ECB calculations.
Notes: Weighted CES estimates covering survey waves from April 2020 to December 2023. To limit the tenure effect, only the first ten survey responses of an individual are used to calculate the individual correlations. A minimum of five observations are used to calculate the correlation.
5 Conclusion
To summarise, analysis of CES data at the level of the individual reveals that trust in the ECB is a multifaceted concept, with a significant majority of survey respondents expressing either some trust or a high level of trust in the ECB. However, to confirm that the findings in this article also hold in times of lower global uncertainty, the CES sample period would need to be longer. Granularity in the CES trust variable shows that trust is a non-binary concept that extends beyond a simple binary distinction between trusting and not trusting. Although, on a scale of 0 to 10, most survey respondents have a trust level between 5 and 8, around 10% of respondents have no trust in the ECB at all across the sample. Over short or medium-term horizons, an individual’s trust in the ECB tends not to change significantly, with those who have no trust in the ECB being the least likely to change their opinion. Finally, when analysed in conjunction with trust in national central banks and other EU and international institutions, trust in the ECB co-moves strongly with broader institutional trust, and respondents who express no trust in the ECB also tend to have no trust in other institutions. Principal component analysis produces the same result. As the CES has only been running for a relatively short (and turbulent) period of time, the results presented here will need to be confirmed in the longer term as well. Nonetheless, the CES trust variable has already proved to be a useful complement to the long-running Eurobarometer surveys.
The fact that most individuals’ level of trust fluctuates only slightly over short time horizons confirms that trust takes time to build and requires continuous communication efforts by the ECB. Given the importance of citizens’ trust in the ECB for the efficient transmission of monetary policy to economic expectations, its slow-moving nature as confirmed by the CES highlights the need for continuous efforts to build trust in a gradual manner. While a certain degree of scepticism towards any institution is, in principle, a desirable feature of a democracy in which citizens follow the institution’s policy decisions, the findings in this article underline the particular importance of the ECB’s efforts in the area of accountability and transparency. In this regard, clear and effective communication – including, for example, explaining the stabilising role of monetary policy – can boost public trust in the ability of a central bank to deliver on its price stability objective.[35]
See, for example, Christelis, D., Georgarakos, D., Jappelli, T. and van Rooij, M., “Trust in the Central Bank and Inflation Expectations”, International Journal of Central Banking, Vol. 16, No 6, 2020, pp. 1‑37.
The Eurobarometer asks: “Please tell me if you tend to trust or tend not to trust these European institutions: [NAME OF INSTITUTION]”. Respondents can also respond “don’t know”, an answer given by 15% of respondents in the latest survey wave.
On trust, the CES asks: “How much do you trust each of the following institutions and organisations? ECB; European Parliament; European Commission; United Nations; national central bank. (Please rate your level of trust on a scale from 0 to 10, where 0 means you have no trust at all in the institution and 10 means you trust it completely.)”
See, for example, Ehrmann, M., Soudan, M. and Stracca, L., “Explaining European Union Citizens’ Trust in the European Central Bank in Normal and Crisis Times”, The Scandinavian Journal of Economics, Vol. 115, No 3, July 2013, pp. 781-807, for evidence on sociodemographic factors. And see, for instance, van der Cruijsen, C. and Samarina, A., “Drivers of trust in the ECB during the pandemic”, Applied Economics, Vol. 55, No 13, 2023, pp.1454-1476, for evidence on the association between respondents’ expectations regarding their future financial situation and trust in the ECB.
In its pilot phase in April 2020, the CES interviewed around 10,000 consumers from the six largest euro area countries (Germany, France, Italy, Spain, the Netherlands and Belgium), offering nationally representative data. Since 2022, the survey has extended its coverage to five additional countries (Austria, Finland, Portugal, Greece and Ireland), interviewing about 19,000 consumers in total.
Differences between the Standard Eurobarometer and the CES relate to the formulation and ordering of questions, sampling techniques, country coverage and frequency.
During the pandemic, the survey methodology of the Eurobarometer was changed in some respects; for example, the face-to-face interviews that had previously been conducted in respondents’ homes were, in many cases, not possible. Changes in aggregate results of the Eurobarometer might thus also reflect changes in the methodology, thereby limiting the comparability of results from one survey wave to another over the pandemic period. In addition, the regular pattern of two surveys per year was disrupted by the pandemic, resulting in the release of only one survey in 2020, two surveys in 2021 and 2022, and three surveys in 2023.
A partial exception is the analysis by Stanislawska, E. and Paloviita, M., “Responsiveness of Consumers’ Medium-Term Inflation Expectations: Evidence from a New Euro Area Survey”, SSRN, November 2022. This traces individuals through consecutive CES survey waves and shows that their medium-term inflation expectations adjust in response to changes in both their short-term inflation expectations and, to a lesser extent, their inflation perceptions, but that this mechanism is weaker for individuals with high trust in the ECB.
Survey responses of individuals exhibit a “tenure effect”, i.e. the more survey waves a respondent has participated in, the more likely they are to give the same trust score as in the previous wave. The likelihood of an individual adjusting their trust score from the previous month is around 70% in the first few waves in which they participate and then gradually declines, stabilising at around 55-60% as the individual completes more surveys. This effect is independent of when the individual joins the survey and applies to trust in all institutions. Owing to this trend, it is important to distinguish between respondents who have completed many or only a few surveys. Chart 2 therefore includes only the month-on-month change in trust for individual respondents responding to the survey for the second time. In the survey as a whole, the tenure effect is partially mitigated by the fact that each survey wave introduces first-time respondents, while a number of respondents also leave the panel.
The CES does not remind respondents of the answer they provided to the same question in previous surveys. In view of the question using an 11-point answer scale, this suggests strong month-on-month stability in trust levels.
In a panel setting, total variation in the trust of individual i at time t can be decomposed into variation arising from differences in average trust between respondents (“between” variation) and remaining variation arising over time but for the same respondent (“within” variation).
This confirms stylised trends using CES data up until March 2021. See van der Cruijsen, C. and Samarina, A., “Drivers of trust in the ECB during the pandemic”, op. cit.
Scores from 1 to 9 are not given a concrete definition.
Various studies looking at psychology (e.g. Hardin, R., Trust and trustworthiness, Russell Sage Foundation, 2002), organisation (e.g. Lewicki, R.J., McAllister, D.J. and Bies, R.J., “Trust and Distrust: New Relationships and Realities”, The Academy of Management Review, Vol. 23, No 3, July 1998, pp. 438‑458) and marketing (e.g. Harrison McKnight, D. and Chervany, N.L., “Trust and Distrust Definitions: One Bite at a Time”, in Falcone, R., Singh, M. and Tan, Y.H. (eds.), Trust in Cyber-societies, Lecture Notes in Computer Science, Vol. 2246, Springer, December 2001) (for an overview, see Van De Walle, S. and Six, F., “Trust and Distrust as Distinct Concepts: Why Studying Distrust in Institutions is Important”, Institutions and Governance in Comparative Policy Analysis Studies, Routledge, 2020) have argued that trust and distrust are separate constructs and that the absence of trust is not the same as distrust, and vice versa. Both trust and distrust, in contrast to the mere absence of trust, imply an active disposition that includes an expectation regarding the object of the trust or distrust. Hence, both might be more positively correlated with knowledge than the mere absence of trust.
On a 0-10 scale, an individual with a trust level of 0 or 10 can only revise their trust level in one direction (up from 0 or down from 10) or keep it unchanged. Therefore, it is to be expected that the likelihood of keeping the trust level unchanged is greatest at the two ends of the scale.
Inflation expectations are responsive to economic developments across all trust levels. The overall share of respondents with high inflation expectations increases and decreases over time, broadly in line with developments in realised inflation in the preceding months. The shares of respondents with high inflation expectations move in tandem across trust levels, such that the absolute shares change substantially, but the difference between the share for respondents with complete trust and the share for respondents with no trust remains constant.
Trust in the ECB remained stable for several months following the economic shock caused by the Russian invasion of Ukraine, despite an increase in inflation expectations – see Georgarakos, D., Kenny, G. and Meyer, J., “Recent changes in consumers’ medium-term inflation expectations – a detailed look”, Research Bulletin, No 104, ECB, February 2023. More generally, the academic literature documents an anchoring impact of trust on inflation expectations, and recent research has also started to focus on the impact of inflation on trust. Recent papers use instrumental variables such as individuals’ trust in other people (Christelis, D. et al., op. cit., and Brouwer, N. and de Haan, J., “Trust in the ECB: Drivers and consequences”, European Journal of Political Economy, Vol. 74, September 2022, pp. 1-14) and general institutional trust (Mellina, S. and Schmidt, T., “The role of central bank knowledge and trust for the public’s inflation expectations”, Discussion Papers, No 32/2018, Deutsche Bundesbank, 2018) to provide evidence that individuals with higher levels of trust have inflation expectations that are lower and more aligned with the central bank’s target. See, in addition, Rumler, F. and Valderrama, M.T., “Inflation literacy and inflation expectations: Evidence from Austrian household survey data”, Economic Modelling, Vol. 87, May 2020, pp. 8-23, van der Cruijsen, C. and Samarina, A., “Trust in the ECB in turbulent times”, DNB Working Papers, No 722, De Nederlandsche Bank, July 2021, and Stanislawska, E. and Paloviita, M., op. cit., for evidence of trust anchoring inflation expectations. Van der Cruijsen, C., de Haan, J. and van Rooij, M., “The impact of high inflation on trust in national politics and central banks”, DNB Working Papers, No 762, De Nederlandsche Bank, January 2023, finds that higher inflation perceptions negatively impact trust, while Farvaque, E., Hayat, M.A. and Mihailov, A., “Who Supports the ECB? Evidence from Eurobarometer Survey Data”, The World Economy, Vol. 40, No 4, April 2017, pp. 654-677, suggests that expected inflation determines trust.
See Hudson, J., “Institutional Trust and Subjective Well-Being across the EU”, Kyklos, Vol. 59, No 1, February 2006, pp. 43-62; and Hayo, B. and Neuenkirch, E., “The German public and its trust in the ECB: The role of knowledge and information search”, Journal of International Money and Finance, Vol. 47, October 2014, pp. 286-303.
See Box 1 in the article entitled “Economic inequality and public trust in the European Central Bank”, Economic Bulletin, Issue 3, ECB, 2022.
Previous studies found that age is positively related to trust, as measured in binary terms in the Eurobarometer (see Ehrmann, M. et al., op. cit., and Farvaque, E. et al., op. cit.), while analyses that used non-binary measurements (see Hayo, B. and Neuenkirch, E., op. cit., and van der Cruijsen, C. and Samarina, A., “Drivers of trust in the ECB during the pandemic”, op. cit.) found that the relationship can be visualised as a U shape, meaning that young and old age groups have relatively high trust levels, while trust is lowest for middle-aged individuals.
Ehrmann, M. et al., op. cit., and Farvaque, E. et al., op. cit., using Eurobarometer data, found that women trust the ECB less than men. However, Hayo, B. and Neuenkirch, E., op. cit., based on a survey of German households, and Brouwer, N. and de Haan, J., op. cit., based on a survey of Dutch households, suggested the opposite. Van der Cruijsen, C. and Samarina, A., “Drivers of trust in the ECB during the pandemic”, op. cit., examining data from the ECB’s Consumer Expectations Survey, found that men have more trust in the ECB than women.
Van der Cruijsen, C. and Samarina, A., “Drivers of trust in the ECB during the pandemic”, op. cit., and Hayo, B. and Neuenkirch, E., op. cit., find a positive relationship between financial knowledge and mean trust in the ECB.
In comparison, an earlier Economic Bulletin article looked at this association in a linear form, suggesting that high perceived income inequality is associated with lower average trust in the ECB. See Box 1 in the article entitled “Economic inequality and public trust in the European Central Bank”, Economic Bulletin, Issue 3, ECB, 2022.
Survey design may also matter for correlation in trust across institutions, as questions about trust in the different institutions are grouped in one section of the survey and respondents may display survey fatigue, attributing identical trust levels to all institutions. The CES attempts to partially mitigate this concern by randomising the order of institutions in the survey (except for the national central bank, which always appears last).
Multiple studies of trust in the ECB refer to such associations and correlations with trust in other institutions (e.g. Ehrmann, M. et al., op. cit.; Hayo, B. and Neuenkirch, E., op. cit.; Farvaque, E. et al., op. cit.; Mellina, S. and Schmidt, T., op. cit.; and Brouwer, N. and de Haan, J., op. cit.) and typically control for this in regressions on the drivers of trust in the ECB.
PCA results indicate that 85% of the full sample variation is explained by the first component, which has similar loadings across all institutions and can thus be interpreted as an approximation of trust in institutions in general. PCA is a data reduction technique in which the principal components are those linear combinations of variables that explain the highest share of variation in the original data. Loadings are the correlations between the original (trust) variables and the principal components, and hence are usually named after the set of variables they are most correlated with. Caveats for this analysis are that the survey includes only one national institution and only five institutions overall, and that the sample period covers several diverse economic shocks to the euro area that may limit the generalisability of results. PCA is also used in Hayo, B. and Neuenkirch, E., op. cit., and Mellina, S. and Schmidt, T., op. cit., to extract a common component of general institutional trust.
Using a survey of Dutch households, van der Cruijsen, C. et al., op. cit., find that people have less trust in those authorities that they see as having a duty to keep inflation low. At the same time, respondents’ views suggest that they are more likely to regard controlling inflation as a responsibility of the national government (over 70%), rather than a responsibility of the ECB (over 50%) or the national central bank (just under 40%).
See Bergbauer, S., Hernborg, N., Jamet, J.-F. and Persson, E., “The reputation of the euro and the European Central Bank: interlinked or disconnected?”, Journal of European Public Policy, Vol. 27, No 8, January 2020, pp. 1178-1194, which shows that trust in the ECB is dependent on citizens’ satisfaction with the EU’s performance in several areas, notably as regards tackling crises.
The rotation relaxes the assumption in the unrotated PCA that factors are completely orthogonal to each other and allows variables to cluster around components.
PCA results on changes in trust suggest that respondents adjust their trust in the ECB strongly in line with changes in their trust in national central banks (second principal component loading of 0.65 for the ECB and 0.76 for the national central bank).
All PCA results also hold when leaving out trust values of 0 to account for potential left-censoring of the trust value distribution.
This is also true after correcting for the tenure effect described in footnote 9, as correlations rise the longer respondents remain on the survey panel. The correlations calculated for individuals are based on a minimum of five observations per set of institutions and a maximum of ten observations (to limit the impact of the tenure effect).
While Section 4 reports the full pooled sample correlation across individuals and over time, this box looks at the average correlation over time for an individual.
As the distribution of the trust variable is potentially left-censored, the estimates shown in panel a of Chart A are based on a quadratic fitted line.
See Ehrmann, M., Georgarakos, D. and Kenny, G., “Credibility gains from communicating with the public: evidence from the ECB’s new monetary policy strategy”, Working Paper Series, No 2785, ECB, February 2023.