Published as part of the ECB Economic Bulletin, Issue 4/2022.
Euro area HICP food inflation reached a new historical high in May 2022 as already existing price pressures in the food sector intensified following the Russian invasion of Ukraine. The war and its repercussions are hindering imports of energy and food commodities in the euro area and contributing to higher global prices. The situation is exacerbating already existing pressures in both global and euro area food markets. This box examines recent developments in euro area food inflation and the channels through which it is affected by the Russia-Ukraine war.
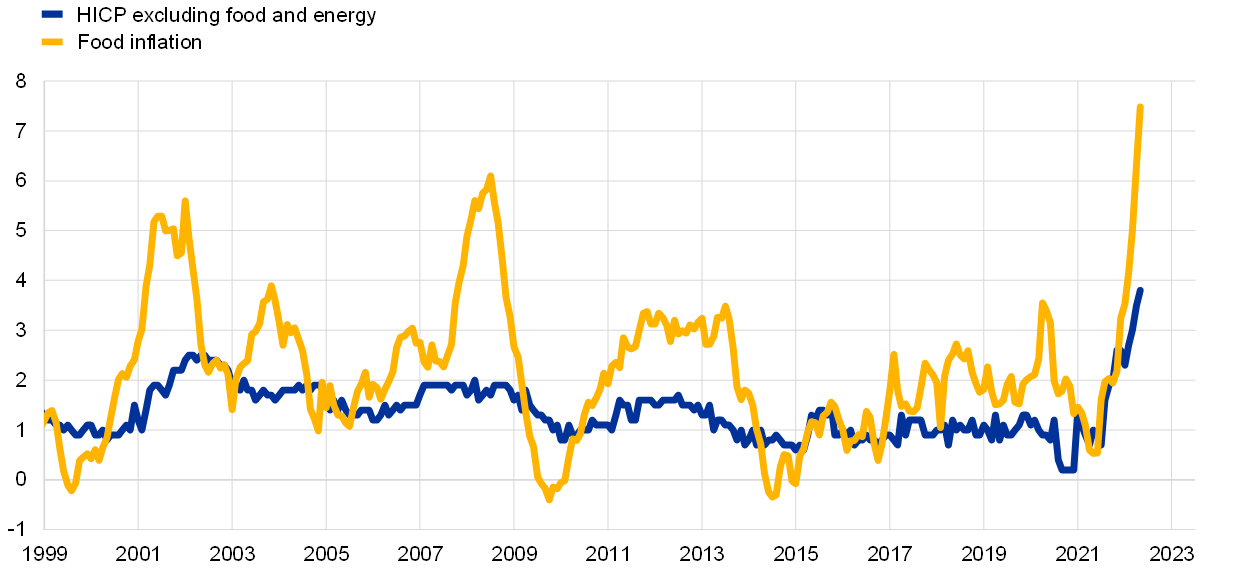
HICP food inflation was already rising before the Russian invasion of Ukraine (Chart A). Food prices can be an important driver of euro area headline HICP inflation, given the high weight of food in the consumption basket (slightly above 20%) and the strong volatility of food inflation.[1] Annual food price inflation edged up during the first wave of the coronavirus (COVID-19) pandemic owing to supply constraints, but subsequently declined. Food price inflation then accelerated from the fourth quarter of 2021, reaching 3.5% in January 2022 and 7.5% in May 2022, the highest level since the beginning of monetary union. Previous peaks in annual food price inflation were seen in early 2002 (5.6%), when health concerns associated with animal diseases put upward pressure on unprocessed food prices,[2] and in 2008 (6.1%), which reflected a rise in global food commodity and fertiliser prices.[3] In April 2022 food inflation stood at 9.4% in the United States and 6.7% in the United Kingdom; thus in both of those countries it was higher than in the euro area. However, in the last three months, annual food inflation has accelerated more in the euro area (by 2.8 percentage points since January 2022) than in the other two economies (2.4 percentage points in both the United States and the United Kingdom over the same period).
Chart A
Euro area HICP and food inflation
(annual percentage changes)
Sources: Eurostat and ECB calculations.
Note: Latest observation: May 2022.
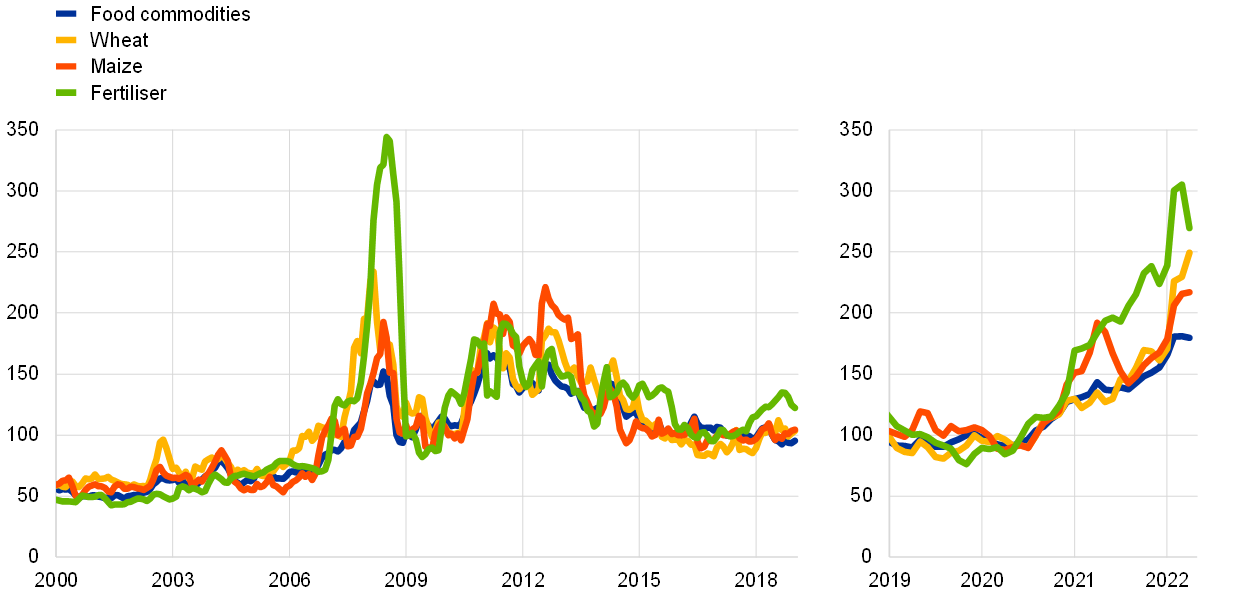
The large increase in euro area food inflation seen since mid-2021 has been driven primarily by the rise in international food commodity and energy prices, which accelerated following the Russian invasion of Ukraine (Chart B). International food commodity prices rose considerably in the second half of 2021, driven mainly by higher energy prices, especially for natural gas.[4] High energy prices affect food inflation via three channels. First, agricultural production and food processing is energy intensive; for instance, crop production relies heavily on fuel for agricultural machinery, so higher energy prices tend to be transmitted quickly to higher production costs. Second, natural gas is an input in fertiliser production; thus higher gas prices increase fertiliser prices, adding to agricultural input costs. Third, rising transportation costs affect food prices, also making the replacement of commodities with those from more distant sources more costly.[5] International food commodity prices also rose as a result of adverse weather conditions in some areas. Moreover, a rise in shipping costs related to bottlenecks in global supply chains added to the price pressures. With the Russian invasion of Ukraine, the prices of some food and energy commodities jumped considerably, reflecting the global role of the affected countries as major suppliers of specific food commodities.[6] Prices for wheat and maize in particular increased sharply. Global fertiliser prices also increased from already elevated levels, resulting in prices almost 200% higher than two years ago.[7]
Chart B
Global food commodity and fertiliser prices
(index: 2020 = 100)
Sources: Hamburg Institute of International Economics (HWWI), Refinitiv and World Bank.
Notes: Latest observation: May 2022. Food commodities include cocoa, coffee, maize, soybean and wheat. Fertiliser prices refer to diammonium phosphate fertiliser.
The strong repercussions of the war for the euro area food sector are explained by its direct impact on production and export capacity in Ukraine and by trade restrictions and increased uncertainty in Ukraine, Russia and Belarus. First, Ukraine introduced a ban on exports of certain food products.[8] The country’s production capacity will also be negatively affected over the longer term as crops cannot be planted or harvested in areas directly affected by the war, workers are not available for production, and production and transport infrastructure is being damaged. Second, the transport of food commodities from Russia has become more expensive owing to increased insurance costs.[9] Supplies of oil and natural gas from Russia have also become uncertain, adding to the upward pressure on the input costs of EU agricultural and food processing sectors. Russia has also banned exports of fertilisers – of which it is the largest global exporter – until August 2022.[10] Third, the EU has adopted further sanctions against Belarus, fully banning the import of potash and fuels, among other products.[11] These restrictions on the international fertiliser trade will result in further price increases both globally and in the euro area, while the reduced supply may also affect global crop yields going forward.
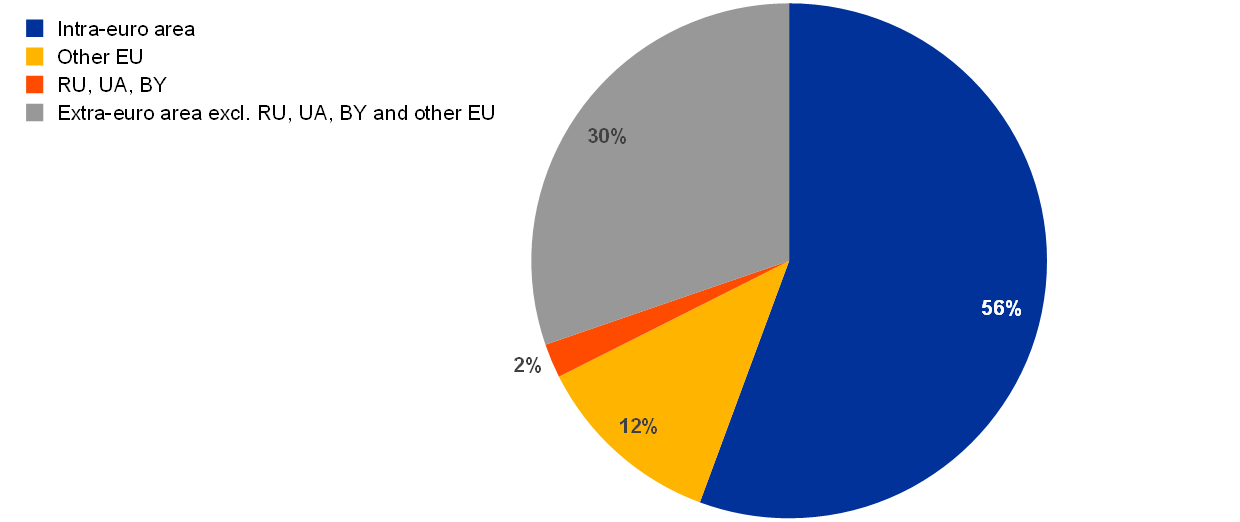
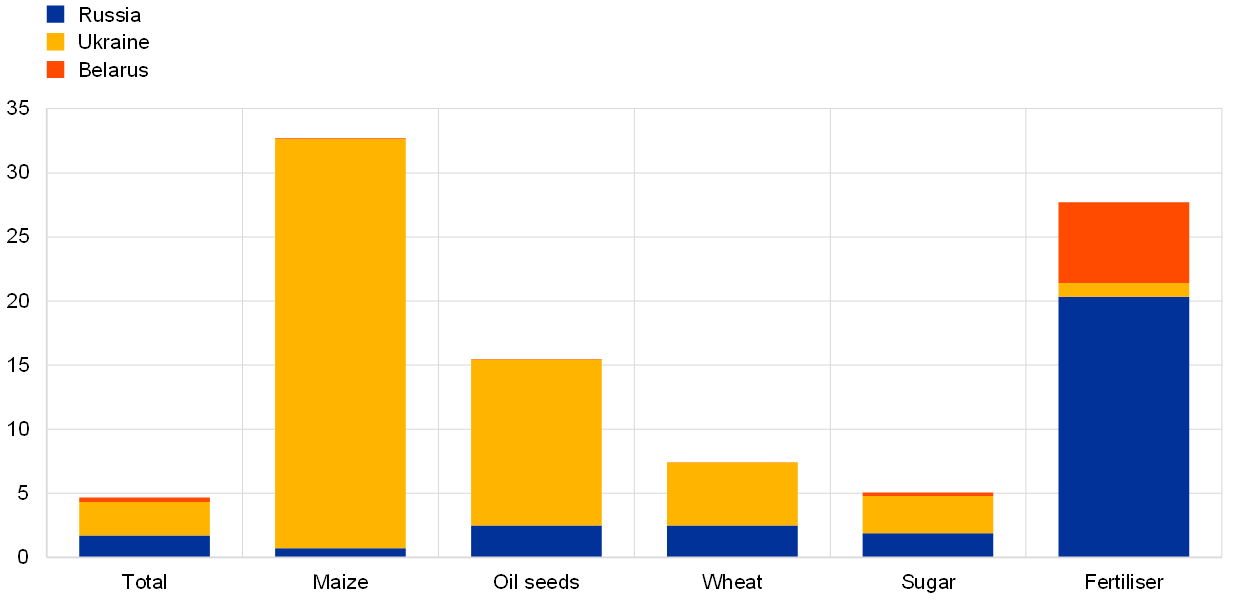
While the overall exposure of the euro area to Russia, Ukraine and Belarus is limited, for certain food commodities there are significant direct exposures to the region involved in the war. The EU is largely self-sufficient in agricultural products, producing more than it consumes.[12] With regard to euro area trade in agricultural products and fertilisers, the largest share is traded within the euro area (57%), while Russia, Ukraine and Belarus together account for only 2% of total euro area imports (Chart C, panel a).[13] Breaking the imports down by product, the euro area imports a large share of maize from the affected region (primarily from Ukraine), which is mainly used in animal feed (Chart C, panel b). Oil seed, wheat and sugar imports, mainly from Ukraine, are also significant.[14] These imports influence HICP food inflation via the value chain, and, as the supply of these specific goods in global markets is tight, additional delivery constraints may drive prices significantly upwards. For example, households may substitute sunflower seed oil with other vegetable or animal oils and fats, but it is also used in a number of processed food products, so the reduced supply has a large impact. The reduced supply of animal feed may also affect meat supplies and prices. Furthermore, the euro area imports more than a quarter of its fertiliser from the affected region, which is difficult to replace from other sources.
Chart C
Euro area exposure to imports of agricultural products and fertiliser from Russia, Ukraine and Belarus
a) Composition of euro area food and fertiliser imports
(percentages of total imports)
b) Euro area exposure to agricultural and fertiliser imports as a share of total extra-euro area imports
(percentages of extra-euro area imports)
Sources: European Commission and ECB calculations.
Note: Data refer to 2020.
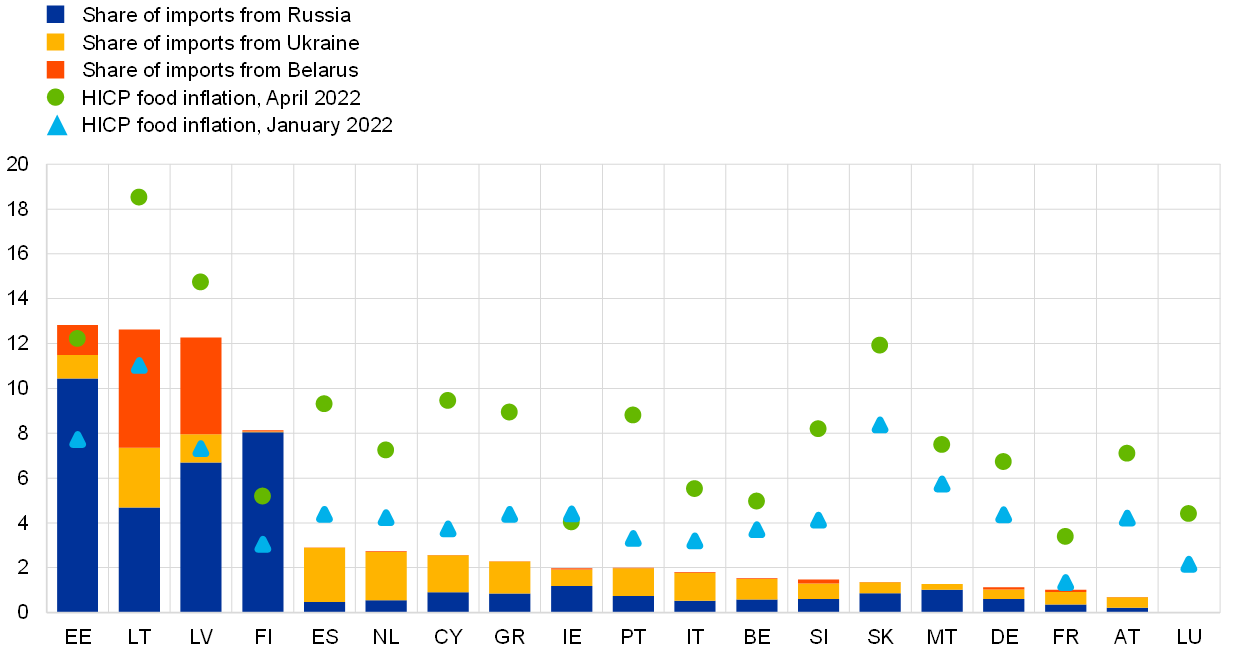
Food inflation has increased more strongly in euro area countries that are more exposed to agricultural imports from Russia, Ukraine and Belarus. The Baltic States and Finland are the euro area countries that are the most dependent on imports of agricultural products and fertiliser from Russia, Ukraine and Belarus (Chart D), which account for between 8% (Finland) and 13% (Estonia) of total imports of these products.[15] In the Baltic States, food inflation has generally been higher and more volatile than in other euro area countries, reflecting the fact that these are small open economies and, hence, are more exposed to fluctuations in international commodity markets. Recent food inflation rates in these countries were the highest within the euro area, ranging from 12% to 19% year-on-year. Differences in HICP food inflation among euro area countries may widen further going forward.
Chart D
Euro area countries’ exposure to agricultural and fertiliser imports from Russia, Ukraine and Belarus and HICP food inflation
(percentages of total imports; annual percentage changes)
Sources: European Commission, Eurostat and ECB calculations.
Note: Data on imports refer to 2020, on HICP food inflation to April 2022.
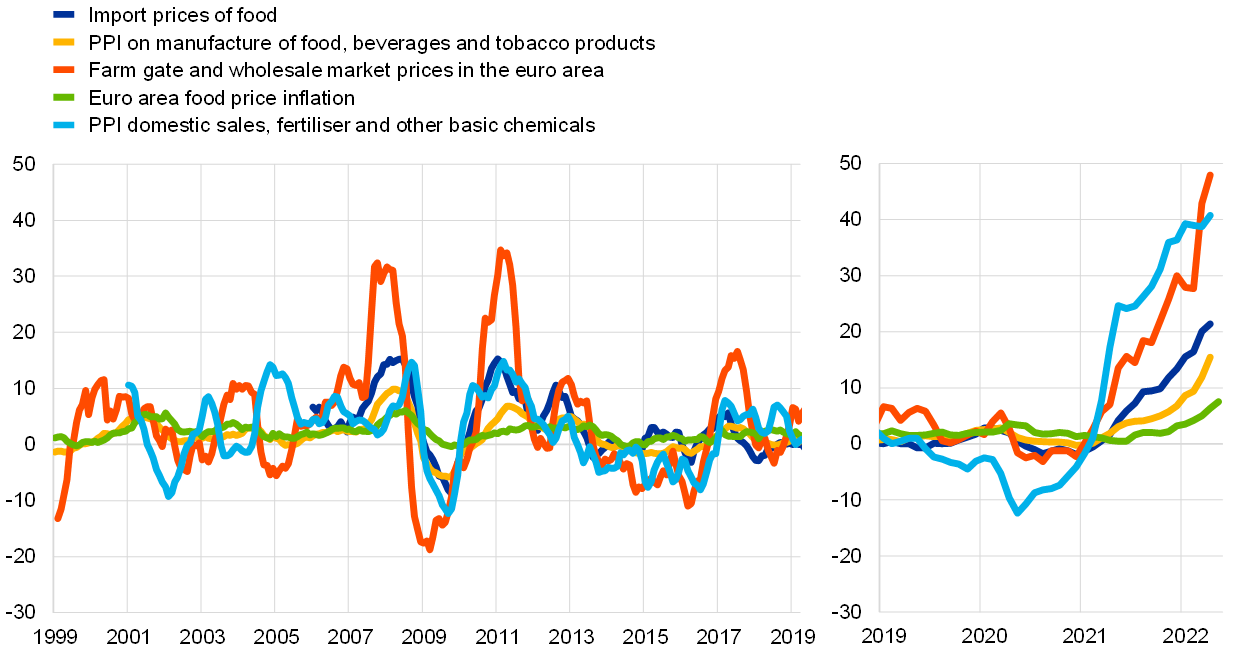
Price pressures in the euro area food sector have further strengthened since the Russian invasion of Ukraine, suggesting that food inflation may stay high (Chart E). Import prices of food were already growing strongly in the euro area, but accelerated further after the invasion, with the annual growth rate rising to 21.4% in April from 16.4% in February. Farm gate and wholesale prices[16] in the euro area also rose considerably, by 47.9% in April after 27.7% in February, driven mainly by prices of cereals. Further along the production chain, producer prices on food products also accelerated after the invasion from already elevated levels. In particular, producer prices of vegetable and animal oils and fats and of animal feed rose considerably in April, by 39.7% and 32.2%, respectively, in annual terms, after 27.4% and 19.3% respectively in February. These price pressures will affect euro area consumer food prices through the pricing chain in the coming months.
Chart E
Pipeline pressures on food and fertiliser prices
(annual percentage changes)
Sources: Eurostat and European Commission.
Notes: Latest observations: May 2022 for euro area food inflation and April 2022 for the rest.
Overall, the euro area’s direct dependence on the region involved in the war is limited apart from specific commodities, but food prices are strongly affected, given the developments in global commodity prices. The euro area’s imports of grains, oil seeds and fertilisers are being hampered owing to the war. Food price inflation is also strongly affected via higher world market prices of these inputs for agricultural production, along with the strong increase in energy prices. Previous episodes of rising food prices were followed by economic adjustments, and food price inflation tended to moderate in the medium term. This time inflation can be expected to stay high in the coming months, despite some counterbalancing factors. Some of the supplies affected by the war could be substituted by supplies from the rest of the world, but at high prices. There is also the possibility of increasing crop production in the euro area (by bringing “ecological focus areas” into cultivation and re-prioritising the maize produced), which would help moderate the impact of the war on grain markets, at least in terms of quantity.[17] Reduced supply of animal feed from Russia and Ukraine can partly be compensated by more supply from other regions (e.g. Latin America), but most likely at higher prices. These counterbalancing measures are unlikely to limit food price increases very much in the short term, as several inputs are difficult to substitute at short notice and are expected to be the main drivers of future food inflation developments.[18] For example, owing to the reduced supply and high price of fertiliser, some pipeline pressures are expected to persist in 2023.
See the box entitled “Recent developments in euro area food prices”, Economic Bulletin, Issue 5, ECB, 2020.
See the box entitled “Recent developments in unprocessed food prices”, Monthly Bulletin, Issue 9, ECB, 2013.
See the box entitled “Agricultural commodities and euro area HICP food prices”, Monthly Bulletin, ECB, June 2010.
See the box entitled “Developments in energy commodity prices and their implications for HICP energy price projections”, Eurosystem staff macroeconomic projections for the euro area, ECB, December 2021.
See Monforti-Ferrario, F., Dallemand, J., Pinedo Pascua, I., Motola, V., Banja, M., Scarlat, N., Medarac, H., Castellazzi, L., Labanca, N., Bertoldi, P., Pennington, D., Goralczyk, M., Schau, E., Saouter, E., Sala, S., Notarnicola, B., Tassielli, G. and Renzulli, P., “Energy use in the EU food sector: State of play and opportunities for improvement”, JRC Science and Policy Report, Publications Office of the European Union, Luxembourg, 2015.
For energy commodities, see the box entitled “The impact of the war in Ukraine on euro area energy markets” in this issue of the Economic Bulletin.
Restrictions on fertiliser exports by China may add to these price pressures. See Bown, C.P. and Wang, Y., “China's recent trade moves create outsize problems for everyone else”, RealTime Economic Issues Watch, Peterson Institute for International Economics, 25 April 2022.
These include rye, barley, buckwheat, millet, sugar, salt and meat.
See “The importance of Ukraine and the Russian Federation for global agricultural markets and the risks associated with the current conflict”, Information Note, Food and Agriculture Organization of the United Nations, 25 March 2022.
See Weil, P. and Zachmann, G., “The impact of the war in Ukraine on food security”, blog post, Bruegel, 21 March 2022.
See Guarascio, F., “EU bans 70% of Belarus exports to bloc with new sanctions over Ukraine invasion”, Reuters, 2 March 2022.
See Short-term outlook for EU agricultural markets in 2022, No 32, European Commission, Spring 2022.
With respect to extra-euro area imports of agricultural products, Russia accounts for 1.7%, Ukraine for 2.6% and Belarus for 0.1%.
Cyprus, Portugal and the Netherlands are the euro area countries most exposed to Ukrainian wheat imports.
The Baltic States are important transit countries for products from Russia and Belarus. With respect to fertiliser, the figures have been adjusted for re-exports.
Euro area farm gate and wholesale prices are collected by the European Commission (Directorate-General Agriculture and Rural Development). Farm gate prices refer to the prices of products at the farm where they are produced and exclude any separately billed transport or delivery charges.
“Supply shock caused by Russian invasion of Ukraine puts strain on various EU agri-food sectors”, European Commission, 5 April 2022.
There are some additional factors that may affect food supply and prices in the euro area, such as global food commodity supplies, export restrictions introduced in some countries after the Russian invasion of Ukraine and stockpiling by euro area households.


