

18 April 2024
We updated our data on the impact of climate change on the financial system. How green are green bonds and banks’ loan portfolios? How strongly could they be affected by natural hazards? The ECB Blog discusses these and other new insights from the data.
The ECB has updated its climate-related indicators. These data provide systemic insights, both into how financial markets are tackling the green transition and how financial institutions may be affected by climate change. The data were first introduced about a year ago and are a work in progress. They are released as experimental and analytical indicators, and this second release comes with major improvements and additional insights.
This post highlights some of the new insights we can derive. The data, as well as a more detailed description and analysis, are available on our climate-related indicators website.
How transparent is the market for green bonds?
More and more debt securities issued in the euro area and globally are marked as green, social, sustainable or sustainability-linked. Overall, while the market share has grown by 50% since 2021, it remains modest and holdings of such instruments in the euro area only represent around 6% of the total market.
Our sustainable finance indicator distinguishes between self-declared sustainable bonds and those that have received a second, external opinion. Around 85% of all euro area sustainable debt issuances have received such a second party opinion, with virtually all green debt securities issued having obtained one (Chart 1). Such additional assessments give investors more information and potentially reassurance that green bonds are what they claim to be. “Greenwashing” or making false or misleading statements about the environmental benefits of a product or practice, is a concern for investors and data users in general. Second party opinions reduce the room for greenwashing, increase transparency and help to strengthen confidence on the green finance markets.
Chart 1
Euro area issuances of sustainable debt securities – share of securities with second party opinion
(Percentages)
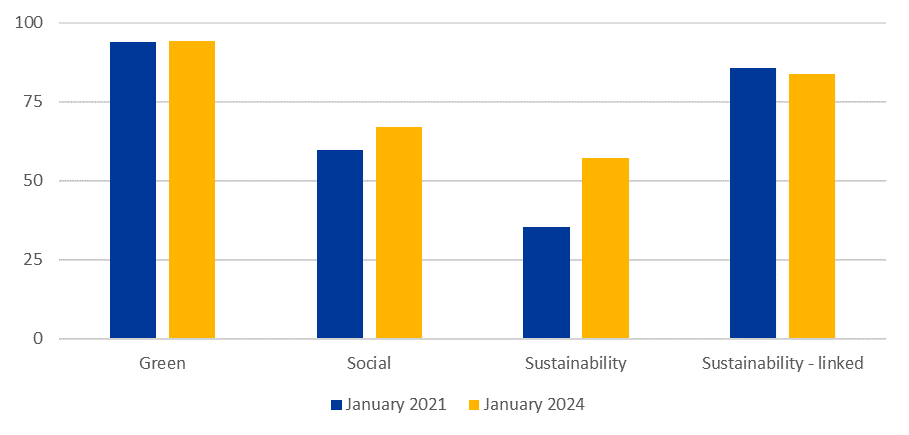
Source: Centralised Securities Database (CSDB).
Notes: Share of issuances with second party opinion refers to sustainable debt securities with second party opinion as a share of all sustainable debt securities.
Are banks’ loan portfolios becoming greener?
Our carbon emissions indicators provide information on the carbon intensity of the economic activities financed by securities and loan portfolios of the euro area financial sector. They also inform about the sector’s exposure to counterparties with carbon-intensive business models. This data set includes information on financed emissions: the amount of emissions from corporate customers that banks are financing.
The updated version we have just published now allows the data to be analysed as consistent time series. As can be seen in Chart 2, direct emissions financed via euro area bank loans generally show a downward movement between 2018 and 2020. The indicator increased slightly in 2021, the latest year that source data are available for. This uptick might be a result of increased economic activity as pandemic restrictions loosened.
However, that is not a complete answer to the question banks are greening their loan portfolios. Reductions in financed emissions can theoretically come from two sources: from the emissions of the loan portfolio or from a general decrease in the bank's investment share. Additional new data breakdowns allow analysis of this aspect and show that the general decrease in euro area financed emissions is mostly due to companies that are reducing the carbon emitted in their processes or banks shifting their investment to companies that emit fewer greenhouse gasses.
Chart 2
Corporate emissions financed via loans by euro area banks
(euro area, million tonnes of CO2 equivalent)
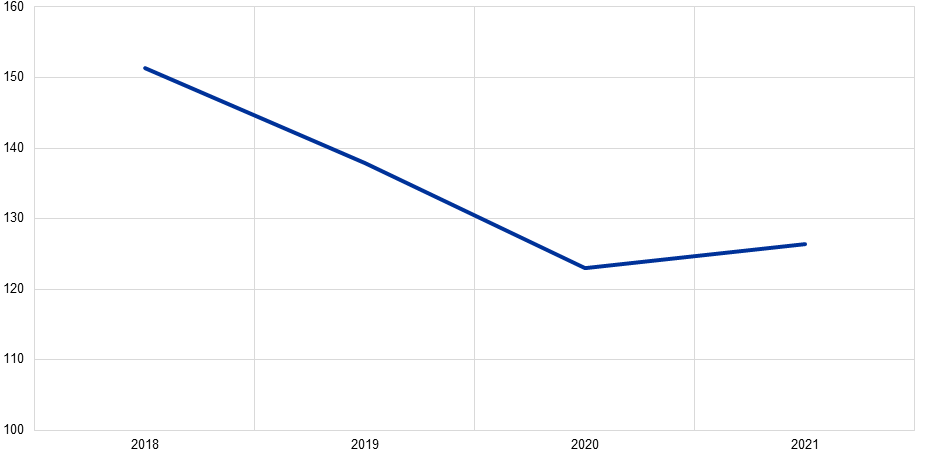
Sources: ESCB calculations based on data from AnaCredit, Register of Institutions and Affiliates Database (RIAD), EU Emissions Trading System (EU ETS), and Eurostat Air Emissions Accounts (AEA).
Do loan collateral and other measures reduce potential flooding losses?
Our physical risk indicators can help analyse the impact of natural hazards, such as floods, wildfires or windstorms, on the performance of banks’ loans, bonds and equities portfolios. We look at this issue from different perspectives.
Risk scores, which split the risk into categories from low to high, are the most widely used measure. However, they do not allow for comparison across different hazards. For example, the effects of high-water stress, which is a high ratio between total water withdrawal and available renewable surface water, cannot be compared to the high risk of flooding. To allow for such comparisons, we present an indicator that aims to quantify the potential losses in financial terms. Capturing the financial impact helps us assess the effectiveness of climate adaptation measures (such as flood defences) and financial mitigation strategies (such as collateral pledged with the loans). For example, the newly introduced collateral-adjusted exposure at risk (CEAR) indicator provides an aggregate estimate of expected losses within banks portfolios considering various loan protections. These could be, for instance, financial guarantees or real estate collateral. The physical collateral can be damaged following a natural disaster, and an associated reduction in its value is also accounted for in the calculation of the CEAR. Chart 3 presents an expected reduction in financial institutions potential losses stemming from the application of these loss mitigation measures.
Chart 3
Estimated reduction in potential river flooding losses
Collateral-adjusted exposure at risk (CEAR) indicator, RCP8.5 climate scenario for 2050; loans of euro area financial institutions towards non-financial corporations, annualised.
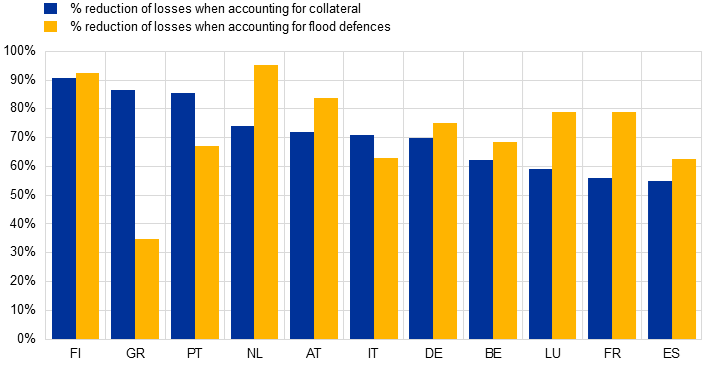
Sources: ESCB calculations based on AnaCredit, RIAD, SHSS, Delft University of Technology (TUD), Joint Research Centre (JRC).
Note: Selected countries based on relevance on relevance of the flood risk and sample size. Some countries are removed due to statistical confidentiality constraints.
Conclusions: Improved data leads to improved understanding
Since the initial release of our climate-related indicators in January 2023, we have made significant improvements in coverage, time consistency and granularity of the data. These improvements are also the result of the feedback we received. A dedicated statistical paper provides more detailed information on the data, methodological choices and remaining limitations.
The questions posed at the beginning of this blog post can, after the recent data enhancements, now be answered. We are seeing progress in the case of sustainable bonds, financing carbon emissions via bank loans, and protection measures against the financial losses from floods. On the other hand, as mentioned in another recent ECB Blog, much more needs to be done.
Our data work continues. Making data more easily accessible and continuously improving data quality remains a concern to policymakers and other stakeholders. We hope that as we progress more of our, and your, questions can be answered. We encourage you to continue to give us feedback as that often stimulates our methodological improvements.
Overall, the data fog is clearing but we still are aiming for even better visibility.
The views expressed in each blog entry are those of the author(s) and do not necessarily represent the views of the European Central Bank and the Eurosystem.
The work described in this blog was undertaken by the ECBs Statistics Committee and its substructures. I am grateful to Dimitra Theleriti, Vanessa Schöller, Malgorzata Osiewicz, Pietro Bellamio and Leslie Yvonne Pio for their contributions to this blog post.