


Happy anniversary, BLS – 20 years of the euro area bank lending survey
Happy anniversary, BLS – 20 years of the euro area bank lending survey
Published as part of the ECB Economic Bulletin, Issue 7/2023.
1 Introduction
Since its launch in 2003, the euro area bank lending survey (BLS) has provided valuable early indications for the assessment of bank lending conditions in the euro area. The BLS is one of the longest existing Eurosystem surveys. It was launched by the Eurosystem in 2003, to enhance the knowledge of bank lending conditions in the euro area.[1] Bank credit standards (that is, their loan approval criteria), actual terms and conditions on new loans, and the demand for loans vary over the economic and monetary policy cycle and may, at times, be driven by financial crises or emergency financing needs. These developments, reported in great detail by banks in the BLS at a quarterly frequency, support the assessment of the drivers of bank lending conditions and provide early indications of bank lending dynamics, which is important for the assessment of the transmission of monetary policy.
The recorded public interest in the BLS has increased significantly over time. Interest in the BLS has traditionally been higher during financial crises and periods of high uncertainty than during quieter periods. In addition, interest in the BLS has increased considerably over time and has been especially high during the monetary policy tightening period since 2022, potentially also reflecting the relevance of soft information to determine the appropriate level and duration of the monetary policy tightening. Specifically, more than 5,000 users visited the BLS publication pages during the first week after the release of the survey for the first quarter of 2023 – a historical peak, according to ECB analysis. In addition to the BLS, which focuses on the perspective of the banks, other ECB surveys provide further soft information on economic developments in the euro area, complementing the information from the BLS.[2]
This article reviews bank lending conditions and loan demand and their leading indicator properties for loan growth and economic activity for euro area firms and households over the existence of the survey, spanning the last 20 years.[3] Section 2 looks at the early days of the survey, from 2003 to 2007. Section 3 covers the period from 2008 to 2014, which saw the global financial crisis, the sovereign debt crisis and its immediate aftermath. Section 4 analyses the period of unconventional monetary policy measures until 2019. Section 5 takes stock of the BLS during the COVID-19 pandemic from 2020 to 2021. Section 6 analyses the monetary policy tightening period since 2022, and Section 7 concludes by assessing the past, present and future role of the BLS.
2 Loan supply and demand in the early days of the euro area – 2003-2007
The period ahead of the global financial crisis (GFC) was marked by strengthening economic growth, increasing inflationary pressures and double-digit loan growth, to which monetary policy responded with rate hikes. Following a period of weaker growth and monetary accommodation at the beginning of the century, the euro area economy recovered from mid-2004 until 2006, and growth remained solid in 2007. In response to rising risks to price stability in the context of the strengthening of the euro area economy, the ECB started to increase its key policy rate in December 2005, from an initial level of 2.00%, to 4.25% in July 2008.[4]
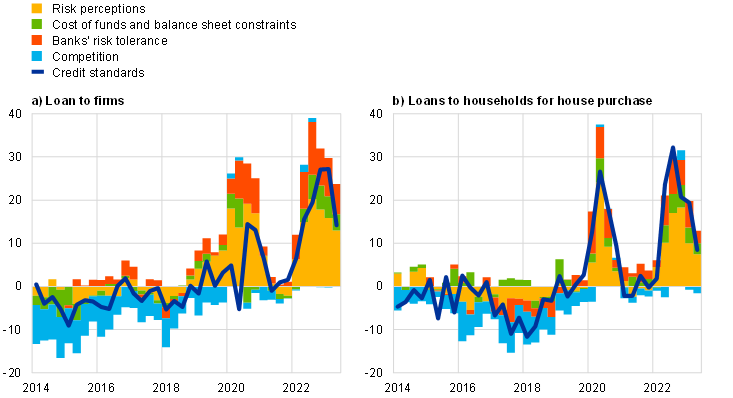
Loose bank lending conditions contributed to a build-up of risks ahead of the GFC. During most of the monetary policy tightening period ahead of the GFC, banks eased their credit standards in net terms or kept them broadly unchanged for loans to euro area firms and housing loans (Chart 1, panel a), somewhat in contrast to what monetary policy transmission channels would suggest in response to higher bank funding costs (interest rate channel) and rising credit risks of borrowers (balance sheet channel).[5] In fact, the net percentages of credit standards on loans to firms were mostly negative from the third quarter of 2004 until the second quarter of 2007, implying a net easing of bank lending policies. The BLS flagged the limited importance banks were allocating to credit risks during this period, as risk perceptions had only a small tightening impact on credit standards, while competition had a large easing impact (Chart 2, panel a).[6] Demand for loans, on the other hand, continued to increase over this period (Chart 1, panel b). This is in line with the typically lagging response of lending to rising interest rates, in periods of growing fixed investment, robust mergers and acquisitions activity, favourable housing market prospects and high consumer confidence. This was accompanied by double-digit annual growth rates of loans to euro area firms (peaking in April 2008, at 15%) and of loans to euro area households for house purchase (peaking in March 2006, at 12.2%; Chart 1, panel c). Overall, credit supply and demand developments reported by banks in the BLS clearly signalled that financial stability risks were building up in the euro area banking sector during this period and, more generally, in the euro area economy.[7]
Chart 1
Bank lending conditions, demand for loans and bank lending to firms and households for house purchase, 2003-2014
(panels a) and b): cumulated net percentages of banks; panel c): annual growth rates)
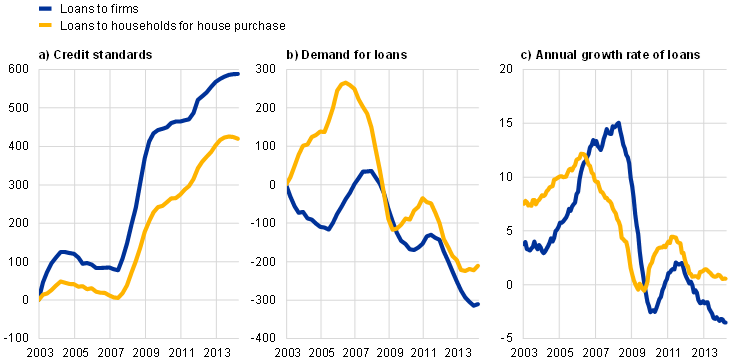
Sources: ECB (BLS and BSI) and ECB calculations.
Notes: Net percentages for credit standards are defined as the difference between the sum of the percentages of banks responding “tightened considerably” and “tightened somewhat” and the sum of the percentages of banks responding “eased somewhat” and “eased considerably”. Net percentages for the questions on demand for loans are defined as the difference between the sum of the percentages of banks responding “increased considerably” and “increased somewhat” and the sum of the percentages of banks responding “decreased somewhat” and “decreased considerably”. Cumulation starting in the first quarter of 2003 (base period = Q4 2002). For credit standards, the cumulation is affected by the fact that the historical average of the series is above zero (9% for loans to firms and 7% for housing loans). Monthly data on loans to firms are adjusted for seasonal and working day effects as well as for sales, securitisation and cash pooling from 2004 onwards. Monthly data on loans to households for house purchase are adjusted for seasonal and working day effects from 2004 onwards. The latest observations are for the first quarter of 2014.
Chart 2
Importance of factors having an impact on credit standards, 2003-2014
(net percentages of banks)
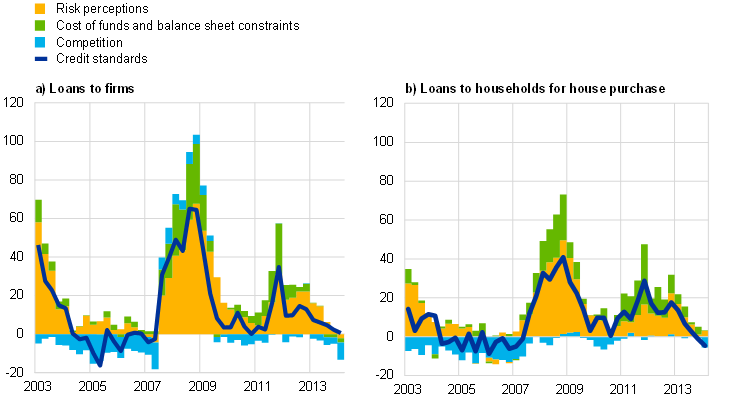
Source: ECB (BLS).
Notes: See the notes to Chart 1. The net percentages for responses to questions relating to contributing factors are defined as the difference between the percentages of banks reporting that the given factor contributed to tightening credit standards and the percentages of banks reporting that it contributed to easing credit standards. The latest observations are for the first quarter of 2014.
3 Risk perceptions and financial frictions at work – 2008-2014
Banks reacted to the GFC with an abrupt change in risk perceptions, leading to sharp spikes in the tightening of bank credit standards. Following the first warning signs of the end of the housing market boom in the summer of 2007, the US subprime crisis escalated in September 2008 with the bankruptcy of the US investment bank Lehman Brothers and spilled over dramatically to the euro area. While the ECB, along with other central banks, cut its key policy rates and provided liquidity assistance, the crisis led to unprecedented spikes in the tightening of banks’ credit standards (Chart 2).[8] From the third quarter of 2008 until the second quarter of 2009, a high net percentage of banks reported a tightening of their credit standards on loans to firms (with a peak of 65% in the third quarter of 2008) and on housing loans (with a peak of 41% in the fourth quarter). As in later crisis periods, the BLS provided valuable early indications about the size of the shock to the euro area economy via the bank lending channel, in line with its leading indicator properties which help to predict loan growth.[9] Following the start of the net tightening of credit standards and stagnating loan demand for firms in the third quarter of 2007, loan growth to firms decelerated substantially (Chart 1, panel c), and quarterly loan growth came to a halt in the first quarter of 2009 before turning negative. For housing loans, actual loan growth started to weaken earlier compared with loan growth to firms, already slowing in 2007. The net tightening of credit standards in the autumn of 2008 for both loans to firms and housing loans was largely driven by a surge in the perception of risks, which tends to be the main driving factor at the aggregate level in tightening episodes related to the economic outlook and borrowers’ creditworthiness.[10]
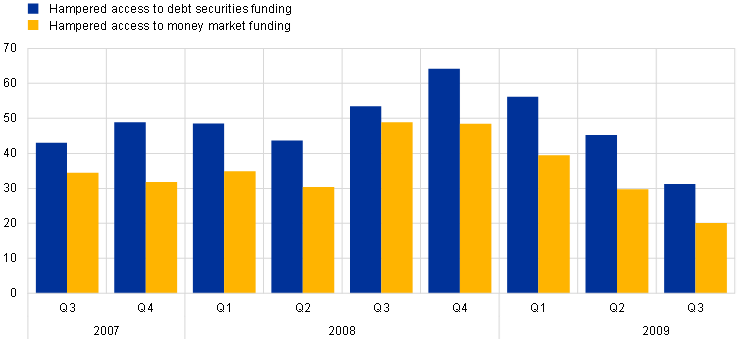
During the GFC, the BLS also provided evidence of bank balance sheet constraints and hampered access to funding leading to restrictions in credit supply. On top of rising risk perceptions, euro area banks reported a substantial tightening impact stemming from their cost of funds and balance sheet position on their credit standards (Chart 2), reflecting the environment of high financial stress. This pointed to serious problems in the bank-based transmission of monetary policy to bank lending conditions. The difficult situation in the banking sector was also reflected in a freeze of the money markets and a significant rise in bank bond spreads, resulting in overall impaired access to market-based funding. This worrisome development for the bank-based transmission of monetary policy warranted the introduction of one of the first ad hoc questions in the BLS questionnaire, related to banks’ access to funding. Euro area banks reported that the financial market turmoil had hampered their access to unsecured interbank money market and debt securities funding, especially between the third quarter of 2008 and the first quarter of 2009 (Chart 3, panel a). This reflected high uncertainty among market participants and banks alike about the actual health of the banking system. The BLS proved helpful in collecting early evidence on the impact of the financial turmoil and the GFC with respect to its effect on bank capital, loan margins (defined as the spread over relevant market reference rates) and lending. The survey also shed light on the mitigating effects of some governments’ announcements of recapitalisation support and state guarantees on banks’ access to wholesale funding, as well as bank recapitalisation measures and bank balance sheet cleaning operations in the decade following this crisis (Section 4).[11]
Chart 3
Financial frictions and banks’ access to funding
a) Access to funding
(net percentages of banks)
b) Deterioration in access to funding
(net percentages of banks)
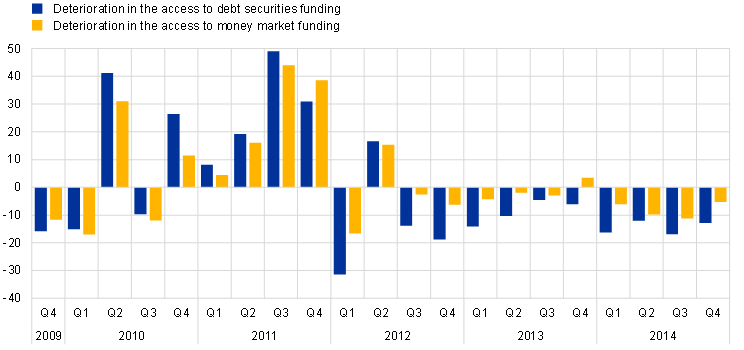
Source: ECB (BLS).
Notes: Panel a): Access to funding based on the BLS ad hoc question “As a result of the situation in the financial markets, has your market access been hampered when tapping your usual sources of wholesale funding?”, which was included in the BLS from the third quarter of 2007 until the third quarter of 2009. Panel b): From the fourth quarter of 2009 onwards, access to funding based on the revised current version of the question asking for the change (deterioration or improvement) in banks’ access to funding. “Money market funding” refers to unsecured interbank money market funding. The latest observations for panel b) are for the fourth quarter of 2014.
In the period from 2009-2011, the BLS provided supporting evidence of an uneven recovery across euro area countries, and heterogeneity built up further during the sovereign debt crisis. While the euro area economy showed some signs of improvement in 2010 and early 2011, accompanied by a brief and overall modest increase in euro area loan growth, BLS developments signalled an uneven recovery across euro area countries. In Germany and France, banks’ credit standards and margins on average loans to firms eased on average over the period from the third quarter of 2009 until the second quarter of 2011. In Italy and Spain, meanwhile, credit standards for firms continued to tighten and margins on average and riskier loans mostly widened for loans to firms, as signs indicating the risks of a sovereign debt crisis emerged and then intensified. The distribution of lending rates for firms across euro area countries confirmed the elevated heterogeneity in lending conditions.[12] For housing loans, the net tightening of credit standards diminished in all four of these euro area countries, but margins on average and riskier housing loans widened further in Italy and Spain. In addition, housing loan demand remained subdued, especially in Spain, following the burst of the housing market overvaluation and the pre-GFC mortgage lending bubble.
The substantial divergence in sovereign bond yields across the euro area countries also had repercussions on bank access to funding and bank lending conditions. The widening of sovereign yield spreads during the sovereign debt crisis resulted in more severe difficulties for banks to collect liquidity in the wholesale market and ultimately led to diverging lending conditions across countries. In this context, euro area banks reported a net deterioration in their access to funding across all market segments over the period 2011-2012, identifying sovereign tensions as the main cause (Chart 3, panel b and Chart 4). Consistent with this interpretation, monetary policy measures adopted in the early phase of the sovereign debt crisis, such as the fixed rate full allotment of the main refinancing operation tenders and the two very long-term refinancing operations (VLTROs) in 2011 and 2012, helped to mitigate the dampening effect of the crisis on loan growth but did not impede loan contraction in late 2011 and the first half of 2012.[13] It was only with the “Whatever it takes” speech by President Draghi on 26 July 2012 and the announcement of the Outright Monetary Transactions on 2 August 2012 that the root causes of the fragmentation in lending conditions started to be forcefully addressed (Chart 4).
Chart 4
Impact of sovereign tensions on bank funding
(left-hand scale: net percentages of banks; right-hand scale: basis points per annum)
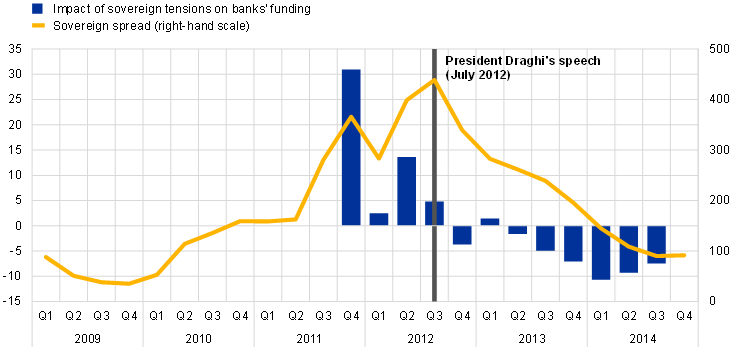
Sources: ECB (BLS), Refinitiv and ECB calculations.
Notes: The sovereign spread is the average five-year yield in Italy and Spain minus the average yield in Germany and France, at quarterly frequency. Aggregate net percentages based on a BLS ad hoc question on the effect of specific factors (e.g. direct exposure to sovereign debt, value of sovereign collateral available for wholesale market transactions), given the tensions in the European sovereign debt market, on banks’ funding conditions. The latest observations are for the third quarter of 2014 for the impact of sovereign tensions on bank funding and for the fourth quarter of 2014 for the sovereign spread.
4 The impact of unconventional monetary policy and supervisory requirements on bank lending conditions – 2014-2019
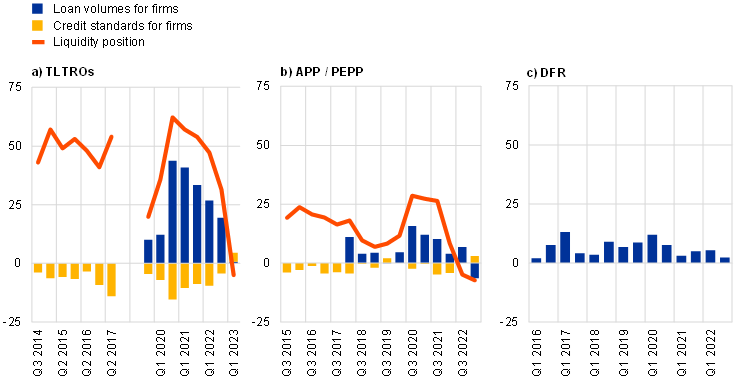
The BLS reflected, in a timely manner, the important role of the ECB’s additional unconventional monetary policy (UMP) measures in reinforcing bank-based transmission.[14] In response to the persistently weak inflation outlook, in early 2014 the ECB reinforced the monetary policy toolkit to ease its monetary policy and enhance the transmission of its accommodative stance. This consisted of introducing a negative interest rate policy (NIRP) in June 2014, three series of targeted longer-term refinancing operations (TLTROs) and the purchase of securities under its asset purchase programme (APP) starting in October 2014.[15] Bank replies in the survey documented the workings of each UMP tool in supporting credit supply. Banks reported a significant increase in lending volumes linked to TLTROs, which helped to further ease banks funding costs.[16] Support to credit supply was also attributed to the negative deposit facility rate (DFR) and the APP (Chart 5), thus confirming the ability of these measures to spur loan originations and contribute to the easing of monetary policy also via bank-based transmission.[17] The APP further complemented the accommodative policy stance by improving banks’ liquidity position (Chart 5) through an increase in customer deposits and sales of marketable assets. This was accompanied by a decrease in banks’ holdings of sovereign bonds, thus documenting the APP’s role in increasing the relative attractiveness of credit creation.[18] Consistent with their replies on credit supply, a substantial net percentage of banks also linked UMP tools to narrowing loan margins and easing credit standards (Chart 5).[19]
Chart 5
Impact of the ECB’s unconventional monetary policy instruments on bank lending, credit standards and liquidity position
(net percentages of banks reporting an increase in loan volumes, an easing of credit standards or an improvement in their liquidity position)
Source: ECB (BLS).
Notes: The time periods shown on the x-axes refer to the respective periods covered by the biannual questions – e.g. Q1 2023 for the period Q4 2022 - Q1 2023. Impact of the first and second series of targeted longer-term refinancing operations (TLTROs), from Q3 2014 to Q2 2017, based on a one-sided question asking only for the easing impact on credit standards. Impact of the third series of TLTROs from Q3 2019 to Q1 2023. Impact on credit standards and liquidity position not available for DFR. Impact on loan volumes not available for TLTRO II, and for APP/PEPP before Q1 2018. The latest observations are for the first quarter of 2023 for TLTROs, the APP and the pandemic emergency purchase programme (PEPP, introduced in March 2020), and for the third quarter of 2022 for the DFR.
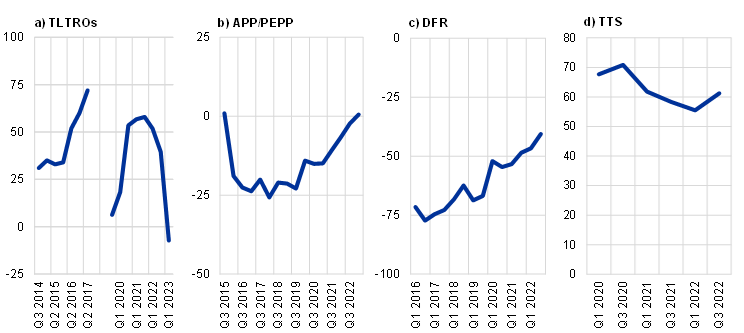
The BLS also provided early indications on the implications of UMP tools on bank profitability. Overall, estimates indicate that UMP measures had a broadly neutral impact on bank profitability between 2014 and 2019 (see Section 6 for the impact of monetary policy tightening on banks’ financial situation). On the one hand, UMP had a significant positive effect coming from increased loan volumes and reduced provisioning and impairment costs, as well as more short-lived impacts related to capital gains.[20] On the other hand, in their replies BLS banks associated NIRP and APP with a deterioration in their overall profitability (Chart 6), likely reflecting first and foremost the overall compression of margins induced by the easing of monetary policy near the effective lower bound, but also the mechanical adverse impact on their profitability of the negative interest charge on outstanding excess liquidity.[21] The importance of the negative remuneration on excess reserves in banks’ replies also implied that the introduction of the two-tier system (TTS), which was explicitly adopted to support the bank-based transmission of monetary policy while preserving the positive contribution of negative rates to the accommodative stance, led to the vast majority of the respondent banks reporting a beneficial effect.[22] In parallel, TLTROs also supported bank profitability to some extent, by compressing bank funding costs and enabling a large credit expansion.
Chart 6
Impact of the ECB’s unconventional monetary policy instruments on bank profitability
(net percentages of banks reporting an improvement)
Source: ECB (BLS).
Notes: The time periods shown on the x-axes refer to the respective periods covered by the biannual questions – e.g. Q1 2023 for the period Q4 2022 - Q1 2023. Impact of the first and second series of targeted longer-term refinancing operations (TLTROs) from Q3 2014 to Q2 2017. Impact of the third series of TLTROs from Q3 2019 until Q1 2023. Impact on profitability not available for DFR and TTS; instead, impact on net interest income is shown for these instruments. The latest observations are for the first quarter of 2023 for TLTROs, the APP and the PEPP, and for the third quarter of 2022 for the DFR and the TTS.
Banks’ replies to the set of UMP-related ad hoc questions show the rich evidence the BLS has been able to provide on the impact of the ECB’s monetary policy measures on the financial situation of banks, bank lending conditions and loan volumes. In response to the monetary policy accommodation over the period, banks mostly eased their credit standards on new loans to firms and housing loans from the second quarter of 2014 until the first quarter of 2019. This was accompanied by a recovery in loan demand and actual loan growth to firms and housing loans (Chart 7).
Chart 7
Bank lending conditions, demand for loans and bank lending to firms and households for house purchase, 2014-2023
(panels a) and b): cumulated net percentages of banks; panel c): annual growth rates)
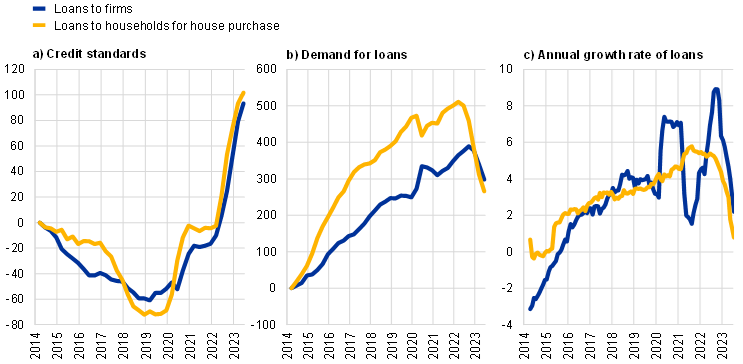
Sources: ECB (BLS and BSI) and ECB calculations.
Notes: See the notes to Chart 1. Cumulation starting in the second quarter of 2014 (base period = Q1 2014). The latest observations are for the second quarter of 2023.
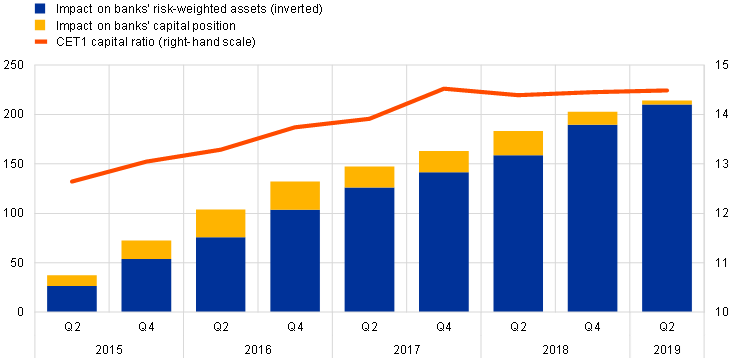
Supervisory actions and regulatory requirements induced banks to accumulate capital and adopt more prudent lending practices while not impeding the transmission of the monetary policy easing to lending conditions. Banks reported increased capital positions and a reduction in risk-weighted assets, in their quest to comply with supervisory requirements (Chart 8, panel a) in the context of the reform of Basel II requirements.[23] In the first years following the announcement of measures to reform Basel II requirements and to set up a Single Supervisory Mechanism in the European Union (2011-2013), bank replies in the BLS pointed to a tightening impact of supervisory requirements on their credit standards, reflecting their intensified efforts towards capital accumulation and balance sheet clean-up.[24] Consistent with the prudential nature of the requirements, the decrease in banks’ risk-weighted assets stemmed from a relative reduction in riskier loans. This is in line with the broadly neutral impact of supervisory requirements on credit standards over the period 2014-2019, after the tightening impact earlier on.[25] In other words, data from the BLS suggest that stricter supervisory and regulatory requirements did not impede the transmission of the monetary policy accommodation after 2014 in itself, but rather contributed to containing unwarranted levels of risk-taking by banks.[26]
Chart 8
Impact of supervisory and regulatory requirements and of banks’ NPL ratios
a) Impact of supervisory and regulatory requirements and evolution of banks’ actual CET1 capital ratios
(left-hand scale: cumulated net percentages of banks reporting an increase; right-hand scale: percentages of risk-weighted assets)
b) Impact of NPL ratios
(net percentages of banks reporting a tightening impact of NPL ratios)

Sources: ECB (BLS and Consolidated Banking Data).
Notes: Panel a), left-hand scale: BLS net percentages on impact on risk-weighted assets are inverted, so decreases in risk-weighted assets are shown as positive contributions to banks’ capital ratios. Panel a), right-hand scale: Consolidated banking data on banks’ CET1 capital ratio. Panel b): The impact of NPL ratios on banks’ credit standards for firms and for loans to households for house purchase. The item “through costs of funds and balance sheet constraints” is the unweighted average of: (a) costs related to banks’ capital position; (b) costs related to banks’ balance sheet clean-up operations; (c) pressure related to supervisory or regulatory requirements. The item “through risk perceptions and risk tolerance” is the unweighted average of these two factors. NPL ratios are defined as non-performing loans and advances gross of impairments as a share of total loans and advances. The latest observations are for the second quarter of 2019 for panel a) and for the second quarter of 2023 for panel b).
Riskier legacy assets on bank balance sheets exerted tightening pressure on their lending policies. This was through the increased cost of funds and balance sheet constraints (higher-NPL banks tend to face less favourable market conditions and also bear the cost burden of any clean-up processes), and lower levels of risk tolerance (the opportunity cost of lending is higher for higher-NPL banks) (Chart 8, panel b). Over time, this tightening impact diminished, reflecting the gradual decrease in realised NPL ratios. The latter was supported by the generalised improvement in borrower quality as a result of monetary policy accommodation, as well as active clean-up processes through sales and securitisations by banks.
5 Bank lending during the COVID-19 pandemic – 2020-2021
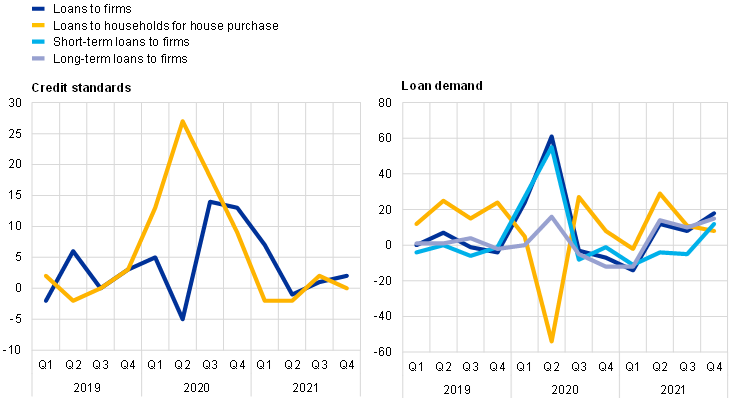
The BLS provided some of the first insights into developments in credit conditions in response to the outbreak of the COVID-19 pandemic. The timing of the April 2020 BLS allowed for a very early snapshot of credit conditions, and to see how banks reacted to the imposition of societal restrictions, new accommodative monetary policy and expansionary fiscal policy measures, and the high uncertainty. Early indications in the first quarter of 2020 showed that credit standards tightened to a smaller extent on loans to firms than on loans to households (Chart 9, panel a). The more contained tightening of credit standards on loans to firms in the first quarter and the expected easing in the second quarter of 2020 provided an early insight into the impact of the large public schemes announced to support firms already in the early stages of the pandemic, whereas credit standards on loans to households were expected to tighten further, driven by risk perceptions. During the initial stages of the pandemic, in the first and especially the second quarter of 2020, loan demand by firms surged against the backdrop of a large-scale “dash for cash”, and higher demand for short term loans, at a time when revenues in some sectors started to collapse.[27]
Chart 9
Net tightening of credit standards during the COVID-19 pandemic and net increase in loan demand by loan categories
a) Credit standards and loan demand
(net percentages of banks)
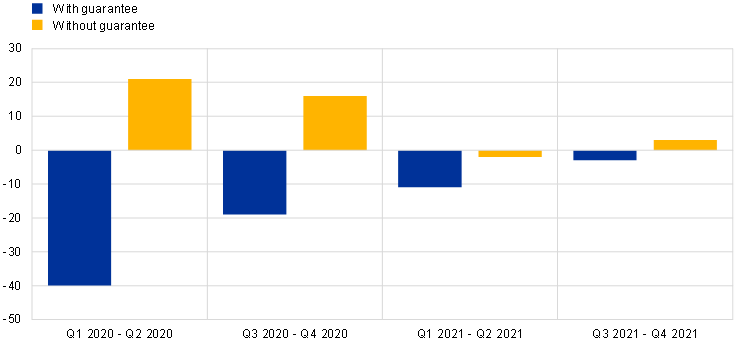
b) Credit standards for loans with and without government guarantees
(net percentages of banks)
Source: ECB (BLS).
Notes: Panel b): Banks’ replies are based on a BLS ad hoc question on changes in banks’ credit standards and demand for loans with pandemic-related government guarantees and for loans without government guarantees. This ad hoc question was included in the survey from the January 2021 BLS, providing information on the first and second half of 2020, until the January 2022 BLS, providing information on the second half of 2021. The latest observations are for the fourth quarter of 2021.
Reflecting the peculiarities of the pandemic, the BLS also showed different dynamics regarding demand for loans between firms and households and between short and long-term loans. In contrast with the surge in demand for loans to firms, households’ loan demand decreased rapidly in the early stages of the pandemic (Chart 9, panel a). High uncertainty about income prospects and a related deep fall in consumer confidence and actual consumption, coupled with a lack of opportunities to realise housing investments in the context of containment measures, led to this large drop in loan demand. In addition, firms’ demand for short-term loans spiked by much more than for long-term loans, reflecting a strong need for shorter-term finance as revenues fell sharply at the beginning of the pandemic. Interestingly, during this period, firms’ demand for longer-term loans was initially still positive, albeit more moderate than for short-term loans, therefore decoupling from developments in fixed investment, which declined significantly. Historically, demand for loans for fixed investment correlated strongly with demand for long-term loans. During the pandemic, however, demand for long-term loans increased somewhat, bolstered by favourable credit conditions, while financing needs for fixed investment declined strongly, reflecting the accompanying steep fall in business investment. This indicated an environment in which capital expenditure was being postponed by firms to compensate for perceived longer-term revenue losses.
BLS ad hoc questions helped to highlight the important support provided by fiscal, monetary and supervisory authorities against the backdrop of widespread uncertainty. At the peak of the COVID-19 pandemic, the ECB announced widespread measures to support the functioning of credit markets, such as a recalibration of conditions for TLTRO III operations with highly accommodative conditions for banks, the expansion of the APP and the commencement of the PEPP. Results from the BLS allowed early anticipation of the easing effect that these measures have provided throughout the pandemic. In addition, support from fiscal authorities was highlighted in a BLS ad hoc question on the differences in lending conditions for loans to firms with and without pandemic-related government guarantees. Guaranteed loans saw a net easing of credit standards, particularly during the early phases of the pandemic, while non-guaranteed loans recorded a net tightening of credit standards (Chart 9, panel b).[28]
6 Monetary policy tightening and the shifts in credit supply and demand since 2022
Against the backdrop of the recent monetary policy tightening, the information provided by the BLS has become particularly important for assessing credit supply and demand in the euro area. In view of the sharp increase in inflation in 2021 and 2022 and the expectation of too-high inflation for some time, the extent and speed of the ECB’s policy rate hikes since July 2022 have been exceptional, aiming to bring inflation down to the ECB’s 2% target in a timely manner.[29] In addition, the end of the ECB’s net asset purchases under the PEPP and APP in March 2022 and June 2022 respectively, the discontinuation of reinvestments under the APP as of July 2023, the recalibration of the conditions on TLTRO III in October 2022 as well as maturing TLTRO III operations have added tightening pressure to bank lending conditions. In this environment, credit standards for lending to firms have tightened substantially since early 2022 (Chart 10, panel a), reflecting the speed and extent of monetary policy tightening and its corresponding transmission through banks. At the same time, the cumulated extent of tightening registered by the BLS has remained below the tightening observed during the GFC (Chart 7, panel a, compared with Chart 1), partly related to the different roles of the BLS contributing factors in the two tightening periods.
Chart 10
Importance of factors having an impact on credit standards, 2014-2023
(net percentages of banks)
Source: ECB (BLS).
Notes: See the notes to Chart 2. “Banks’ risk tolerance” was introduced in the survey questionnaire in the first quarter of 2015. The latest observations are for the second quarter of 2023.
Higher risk perceptions of banks, a decline in their risk tolerance and, to a lesser extent, their balance sheet situation have been the main drivers of banks’ credit standards in the tightening cycle since 2022. The relevance of risk perceptions and declining risk tolerance at the current juncture partly reflects the broad transmission of the monetary policy tightening, given banks’ concerns related to borrowers’ refinancing or repayment risks, especially for highly indebted, low-liquidity and low-income firms in a context of higher interest rates and high inflation (Chart 10, panel a). In this context, NPL ratios re-emerged as a tightening factor for bank lending conditions for loans to firms (Chart 8, panel b), albeit so far in a relatively subdued way. At the same time, the smaller contribution of banks’ balance sheet situation, compared with its elevated contribution to tightening during the GFC (Chart 10, compared with Chart 2), likely reflects the overall more solid capital position of euro area banks as a result of the harmonised and strengthened regulatory and supervisory framework, as well as the presence of monetary policy tools specifically designed to prevent unwarranted fragmentation, such as the Transmission Protection Instrument (TPI).
The evidence of the recent tightening episode shows that a substantial tightening of credit standards, which is associated with a restriction in the supply of credit, does not need to be associated with an episode of a banking crisis, and it may prevail even in a period of recovery of banks’ income. A tightening of credit standards can prevail even in a period of solid bank capitalisation and sound bank profitability. The tightening of credit standards is a general feature that accompanies a phase of tightening of monetary policy and affects the supply of credit through a number of channels, such as the interest rate channel, the bank lending channel (referring to the increase in banks’ funding costs and willingness to lend), the balance sheet channel (referring to the creditworthiness of the borrowers), and the risk-taking channel (referring to banks’ willingness to tolerate risks).
Rising interest rates in the context of tighter monetary policy have been a major factor driving the decrease in demand for loans to firms and housing loans. Loan demand has fallen strongly since 2022, especially for housing loans, for which the net decrease started in the second quarter of 2022, and somewhat later (due to the surge in demand in the context of the energy crisis), in the fourth quarter of 2022, for firms (Chart 7, panel b). This followed an extended period of net increases in loan demand since 2014, interrupted by the pandemic period. It reflects in part the broader role of the interest rate channel of monetary policy, as the tightening of monetary policy induces higher borrowing costs (including via an inward shift of the loan supply curve), thereby dampening economic growth and loan demand (which would manifest as a downward shift of the loan demand curve). The particularly stark response of demand for loans for house purchase strongly reflects the high elasticity of demand to higher borrowing costs. The downward pressure on loan demand from higher interest rates has been accompanied by deteriorating housing market prospects, signalling the interconnectedness of these factors and the recent decline in euro area house prices.
In line with the leading indicator properties of the BLS, both tightening credit standards and decreasing loan demand have signalled, at an early stage, a substantial weakening of loan growth. The early indications from the BLS were confirmed by the actual loan growth developments (Chart 7, panel c). The BLS helps to disentangle credit supply and demand, which have both shifted in response to the monetary policy tightening since 2022. One example of this is the so-called loan supply indicator (LSI), which purges BLS credit standards from changes in loan demand at the bank level and from prevailing macroeconomic conditions. Based on the LSI, one can gauge how much of the observed tightening in credit conditions is due to supply effects over and above the changes in loan demand and macroeconomic conditions (Chart 11).[30] While disentangling credit supply and demand is important for understanding the effects of monetary policy and the emergence of supply constraints, it is important to bear in mind that the impact of tighter monetary policy on credit supply and demand is interdependent. Higher interest rates do not only dampen loan demand but also increase interest burdens and raise refinancing risks of borrowers. Alongside this, via the dampening impact of tighter monetary policy on economic activity, higher interest rates lower corporate profits and potentially lead to higher bankruptcies, which in turn suppresses supply as a result of the elevated risk environment. The indicator of adjusted credit standards shows a marked tightening of credit supply since 2022 at a rate in line with that observed during the GFC, while the raw net percentages of banks reporting a tightening of credit standards appear to have increased less than during the GFC (Charts 2 and 10).
Chart 11
(index)
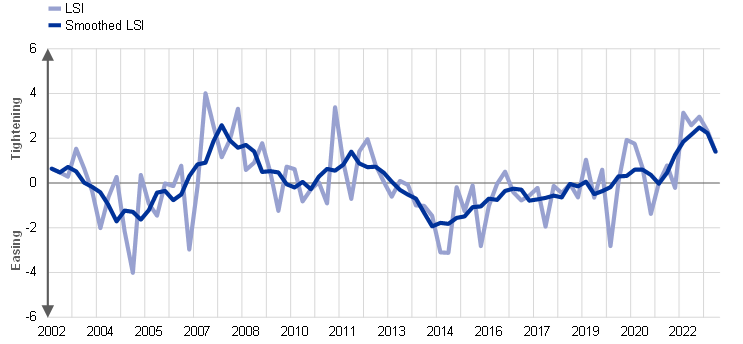
Source: ECB (BLS).
Notes: Loan supply indicator (LSI) for bank lending to firms, as in Altavilla, Darracq Paries and Nicoletti (2019). The smoothed series is a five quarter-centred moving average. Positive values indicate a tightening, while negative values indicate an easing. The latest observations are for the second quarter of 2023.
The ad hoc questions of the BLS can shed light on the challenges faced by banks in the current monetary policy tightening period, notwithstanding banks’ solid capital position. A new BLS question on the impact of ECB interest rate hikes on bank profitability has highlighted that while there was a positive impact stemming from higher net interest margins, the rate hikes weighed negatively on profitability through lower lending volumes, higher provisioning needs and, on occasions, capital losses on banks’ security portfolios.[31] In addition, while the impact of the ECB’s asset purchases and TLTROs on banks’ market financing positions, liquidity positions and lending volumes was positive during UMP times (Section 4), they have begun to weigh negatively on these items as they are phased out – for example, with the end of the ECB’s asset purchases (except for reinvestments in the PEPP) and the declining outstanding TLTRO liquidity due to maturing operations and early repayments. The effects of these measures, in addition to the impact of ECB policy rate hikes, have passed through to lower lending volumes and tighter credit standards (Chart 5).
The BLS also sheds light on the existence of pockets of vulnerabilities in the context of rising interest rates, especially in some economic sectors and for riskier borrowers. Changes in banks’ terms and conditions provide evidence of a stronger tightening of bank lending conditions for loans to riskier firms. First, loan margins have widened substantially more for riskier loans to firms since the fourth quarter of 2021 than for average loans (Chart 12, panel a). Second, cumulated overall terms and conditions have tightened more over this period for loans to small and medium-sized enterprises (SMEs) than to large firms, with the former generally assessed as riskier due to their more opaque balance sheet situation. Third, in line with this development, there has been a stronger increase in collateral requirements for SMEs compared with large firms. Empirical analysis based on bank-firm level data confirms and further extends this evidence, showing that less well capitalised banks adjust their credit standards in response to an increase in bank funding costs more strongly compared with better capitalised banks, especially for firms with a higher default risk.[32] In addition, credit risks in banks’ loan portfolios tend to be larger for some economic sectors, such as the real estate sector. According to data from the BLS, credit standards for loans to the commercial and residential real estate sectors have tightened more than in the other main economic sectors since the start of 2022, consistent with the decline in house prices and related higher risks to collateral values (Chart 12, panel b).[33] Similarly, against the backdrop of continued elevated risks surrounding the energy sector, energy-intensive manufacturing has seen a larger net tightening of credit standards relative to the overall manufacturing sector. This highlights the broad value of the BLS, as it indicates pockets of risk at an early stage.
Chart 12
Bank lending conditions across selected loan categories for firms and credit standards for selected main economic sectors
a) Bank lending conditions
(differences between cumulated net percentages since Q4 2021)
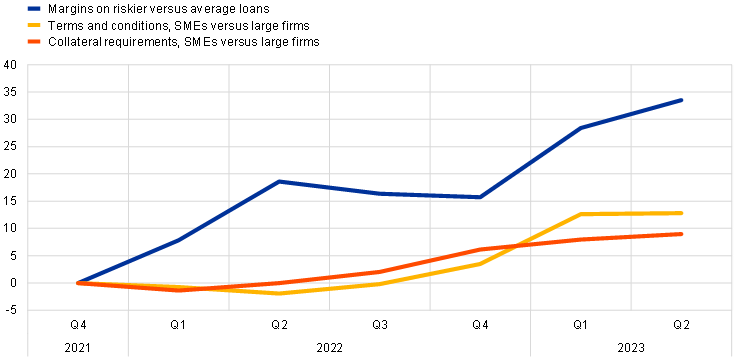
b) Credit standards
(net percentages of banks)
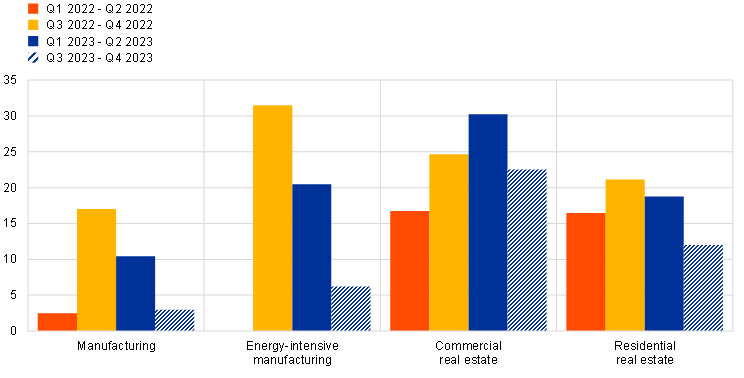
Source: ECB (BLS).
Notes: Panel a): Differences between cumulated net percentages of margins on riskier loans versus average loans and differences between cumulated net percentages of bank lending conditions for loans to SMEs versus loans to large firms. Panel b): “Energy-intensive manufacturing” is a breakdown of the manufacturing sector which was introduced in the period Q3 2022 - Q4 2022. The latest observations are for the second quarter of 2023 and expectations are for Q3 2023 - Q4 2023.
7 Conclusions
Over the past 20 years, the BLS has become an important tool for analysing bank lending conditions in the euro area and informing monetary policy on changes in credit supply and demand. The survey has contributed to a better understanding of bank lending conditions in the euro area and has provided early indications of developments in loan growth some quarters ahead. In addition, it has shed light on the impact of the ECB’s monetary policy measures on bank lending, as well as other important factors affecting bank-based transmission, such as supervisory actions or fiscal measures. Through the lens of the survey, euro area banks appear to have responded to the tightening of monetary policy started in 2022 with an immediate and substantial net tightening of their credit standards on loans to firms and households. This contrasts with the late tightening of credit standards related to low risk perceptions in the monetary policy tightening period ahead of the GFC. In addition, the pass-through of ECB rate hikes has led to a deep fall in loan demand.
The BLS is continuing to evolve and adapt to new policy concerns; most recently, the survey included a new ad hoc question on the impact of climate change on bank lending to firms. Looking ahead, the BLS will continue to take up new topics of interest for monetary policy, thereby helping to deepen the understanding of the development of bank lending conditions in the euro area.
On 15 May 2003 the ECB published, for the first time, the results of its euro area bank lending survey (for the quarters Q4 2002 and Q1 2003), together with the article entitled “A bank lending survey for the euro area”, Monthly Bulletin, ECB, Frankfurt am Main, April 2003. The Senior Loan Officer Opinion Survey on Bank Lending Practices, conducted by the Federal Reserve System in the United States, was a model for the BLS. Participation in the BLS has increased over time, with additional countries joining the euro area and additional banks being added to adequately represent the structure of the euro area banking sector.
See, for instance, the “Survey on the access to finance of enterprises”, which focuses on the perspective of firms, and the “Consumer Expectations Survey”, which focuses on the perspective of consumers.
For a detailed discussion of ECB monetary policy periods, see Rostagno, M., Altavilla, C., Carboni, G., Lemke, W., Motto, R., Saint Guilhem, A. and Yiangou, J., “Monetary Policy in Times of Crisis: A Tale of Two Decades of the European Central Bank”, Oxford University Press, 2021. See also Köhler-Ulbrich, P., Hempell, H.S. and Scopel, S., “The euro area bank lending survey”, Occasional Paper Series, No 179, ECB, Frankfurt am Main, September 2016, and the article entitled “What does the bank lending survey tell us about credit conditions for euro area firms?”, Economic Bulletin, Issue 8, ECB, 2019.
Minimum bid rate for the variable rate tender of the ECB main refinancing operations.
See Maddaloni, A. and Peydró, J.-L., “Bank Risk-taking, Securitization, Supervision, and Low Interest Rates: Evidence from the Euro-area and the U.S. Lending Standards”, The Review of Financial Studies Vol. 24, No 6, 2011, pp. 2121-2165. See also Lane, P.R., “The banking channel of monetary policy tightening in the euro area”, Remarks at the Panel Discussion on Banking Solvency and Monetary Policy, NBER Summer Institute 2023 Macro, Money and Financial Frictions Workshop, Cambridge, Massachusetts, 12 July 2023. See also Task Force of the Monetary Policy Committee of the European System of Central Banks, “Housing Finance in the euro area”, Occasional Paper Series, No 101, ECB, Frankfurt am Main, March 2009, and Task Force of the Monetary Policy Committee of the European System of Central Banks, “Corporate finance and economic activity in the euro area”, Structural Issues Report 2013, Occasional Paper Series, No 151, ECB, Frankfurt am Main, August 2013.
The cumulation of credit standards helps to proxy the level of credit standards over time, although banks’ tendency to report more often a tightening than an easing of credit standards limits the determination of the level of credit standards.
See, for instance, European Central Bank, Financial Stability Review, June 2008.
The ECB cut the interest rate on its main refinancing operations by 325 basis points between October 2008 and May 2009, switching to a fixed rate allotment during this time.
Tightening credit standards in a given quarter tend to lead to weaker loan growth for firms around five to six quarters later (around two quarters for housing loans), while lower demand for loans to firms tends to lead to weaker loan growth for firms around three quarters later (three to four quarters for housing loans). The co-movement of the BLS indicators with net loan growth is weaker for housing loans than for loans to firms, likely related to temporarily high housing loan repayments around ten years after the pre-GFC housing market boom. These repayments dampened net housing loan growth. See the box entitled “What information does the euro area bank lending survey provide on future loan developments?”, Economic Bulletin, Issue 8, ECB, 2022.
See Köhler-Ulbrich, P. et al., op. cit.
See “The euro area bank lending survey – October 2008”, ECB, 7 November 2008, and “The euro area bank lending survey – January 2009”, ECB, 6 February 2009.
See also Altavilla, C., Canova, F. and Ciccarelli, M., Mending the broken link: Heterogeneous bank lending rates and monetary policy pass-through, Journal of Monetary Economics, Vol. 110, 2020, pp. 81-98.
See Ciccarelli, M., Maddaloni, A. and Peydró, J.-L., “Heterogeneous transmission mechanism – Monetary policy and financial fragility in the euro area”, Working Paper Series, No 1527, ECB, Frankfurt am Main, March 2013. On the impact of the VLTROs on credit supply, see Darracq Paries, M. and De Santis, R., “A non-standard monetary policy shock – The ECB’s 3-year LTROs and the shift in credit supply”, Working Paper Series, No 1508, ECB, Frankfurt am Main, January 2013.
For a detailed explanation of the events and rationale surrounding the introduction of the ECB’s UMP measures, see Rostagno, M. et al., op. cit. See also the explanations of the ECB’s UMP measures on the ECB’s website, especially for the asset purchase programmes and the TLTROs.
A first series of TLTROs was announced on 5 June 2014, a second series (TLTRO II) on 10 March 2016 and a third series (TLTRO III) on 7 March 2019.
On the substantial support of TLTROs to lending conditions, see the article entitled “TLTRO III and bank lending conditions”, Economic Bulletin, Issue 6, ECB, 2021. See also Altavilla, C., Barbiero, F., Boucinha, M. and Burlon, L., “The Great Lockdown: Pandemic response policies and bank lending conditions”, European Economic Review, Vol. 156, 2023, and Andreeva, D.C. and García-Posada, M., “The impact of the ECB’s targeted long-term refinancing operations on banks’ lending policies: The role of competition”, Journal of Banking and Finance, Vol. 122, 2021.
On the BLS evidence of the impact of NIRP, see also the article entitled “Negative rates and the transmission of monetary policy”, Economic Bulletin, Issue 3, ECB, 2020. On the impact of the APP, see Altavilla, C., Boucinha, M., Holton, S. and Ongena, S., “Credit Supply and Demand in Unconventional Times”, Journal of Money, Credit and Banking, Vol. 53, No 8, 2021, pp. 2071-2098, and Albertazzi, U., Becker, B. and Boucinha, M., “Portfolio rebalancing and the transmission of large-scale asset purchase programs: Evidence from the euro area”, Journal of Financial Intermediation, Vol. 48, 2021.
For banks’ replies regarding the evolution of their sovereign bond holdings in connection to the APP, see, for instance, the BLS website reports for the first quarter of 2016, the third quarter of 2016, the first quarter of 2017 and the third quarter of 2017.
For banks’ replies documenting the easing impact of TLTROs on their terms and conditions see, for instance, the BLS website reports for the fourth quarter of 2014 (TLTRO I), the fourth quarter of 2016 (TLTRO II), the fourth quarter of 2019 (TLTRO III) and the first quarter of 2021 (TLTRO III). For results documenting the easing impact of the expanded asset purchase programme (APP) on banks’ terms and conditions and net interest margins see, for instance, the BLS website reports for the first quarter of 2016, the first quarter of 2017 and the third quarter of 2020.
See Altavilla, C., Lemke, W., Linzert, T., Tapking, J., and von Landesberger, J., “Assessing the efficacy, efficiency and potential side effects of the ECB’s monetary policy instruments since 2014”, Occasional Paper Series, No 278, ECB, Frankfurt am Main, December 2021.
On the channels through which conventional and unconventional measures impact bank net interest income and other components of bank profitability within a low interest rate environment, see Altavilla, C., Boucinha, M. and Peydró, J.-L., “Monetary policy and bank profitability in a low interest rate environment”, Economic Policy, Vol. 33, Issue 96, 2018, pp. 531-586.
The two-tier system (TTS) was applied by the ECB from September 2019 until September 2022. It introduced a different rate of remuneration for part of a credit institution’s current account holdings in excess of minimum reserve requirements. In particular, the two-tier system was used to exempt part of these holdings from the deposit facility rate (DFR) when the rate was negative. See Boucinha, M., Burlon, L., Corsi, M., Della Valle, G., Eisenschmidt, J., Marmara, I., Pool, S., Schumacher, J. and Vergote, O., “Two-tier system for remunerating excess reserve holdings”, Occasional Paper Series, No 302, ECB, Frankfurt am Main, September 2022.
The European Parliament published its resolution on Basel II and the revision of the Capital Requirements Directives on 7 October 2010. The complete Basel III framework was published by the BIS in December 2010 and updated in June 2011. Basel III requirements were incorporated into EU law via the CRR/CRD IV package, comprising of the Capital Requirements Regulation (CRR, 575/2013/EU) and the Capital Requirements Directive (CRD, 2013/36/EU), applicable as of January 2014. The full implementation of Basel III requirements underwent several extensions, until its full enforcement as of 1 January 2023. The Single Supervisory Mechanism Regulation (1024/2013/EU) was published by the European Parliament in October 2013.
See also Köhler-Ulbrich, P. et al., op. cit.
See the article entitled “What does the bank lending survey tell us about credit conditions for euro area firms?”, Economic Bulletin, Issue 8, ECB, 2019. Banks indicated a tightening impact on credit standards and a decrease in average loans in connection to supervisory requirements over the quarters up to the fourth quarter of 2013, which coincided with broad-based deleveraging and tightening in credit standards amid lower levels of risk tolerance.
See also, for instance, Altavilla, C., Boucinha, M., Peydró, J.-L. and Smets, F., “Banking supervision, monetary policy and risk-taking: big data evidence from 15 credit registers”, Working Paper Series, No 2349, ECB, Frankfurt am Main, January 2020, and Albertazzi, U. et al., “Monetary policy and bank stability: the analytical toolbox reviewed”, Working Paper Series, No 2377, ECB, Frankfurt am Main, February 2020.
See the box entitled “Drivers of firms’ loan demand in the euro area – what has changed during the COVID-19 pandemic?”, Economic Bulletin, Issue 5, ECB, 2020.
See the BLS website reports in which this ad hoc question was included, for instance for the fourth quarter of 2020. See also Falagiarda, M. and Köhler-Ulbrich, P., “Bank Lending to Euro Area Firms – What Have Been the Main Drivers During the COVID-19 Pandemic?”, European Economy – Banks, Regulation, and the Real Sector, 2021.
See, for instance, the ECB’s monetary policy statements on 21 July 2022 and on 14 September 2023.
For details on the construction of the LSI, see Altavilla, C., Darracq Paries, M. and Nicoletti, G. “Loan supply, credit markets and the euro area financial crisis”, Journal of Banking & Finance, Vol. 109, 2019. See also Lane, P.R., op. cit.
A biannual ad hoc question on the impact of the ECB’s key interest rate decisions on bank profitability was introduced in the BLS for the first quarter of 2023.
See Faccia, D., Huennekes, F. and Köhler-Ulbrich, P., “What drives banks’ credit standards? An analysis based on a large bank-firm panel”, Working Paper Series, ECB, Frankfurt am Main, forthcoming.
Compared with the manufacturing, construction, wholesale and retail trade, and services sectors. Energy-intensive manufacturing is not included in this comparison as this breakdown was only introduced in the period Q3 2022 - Q4 2022.