


Published as part of the ECB Economic Bulletin, Issue 4/2023.
High energy and commodity prices and supply bottlenecks have driven strong inflation in the euro area and higher inflation differentials between euro area countries.[1] Cross-country inflation differentials, as measured by the inter-quartile range, rose from historically low levels in the pre-pandemic period to historical highs at the end of 2022 and, albeit decreasing since then, have remained at elevated levels. In May 2023 inflation rates in euro area countries ranged from 2.0% in Luxembourg to 12.3% in Latvia and Slovakia (Chart A). The current high inflation environment has mainly been caused by adverse supply shocks related to increasing energy and commodity prices, supply bottlenecks and post-pandemic reopening effects.
Chart A
HICP inflation differentials in the euro area countries
(annual percentage changes)
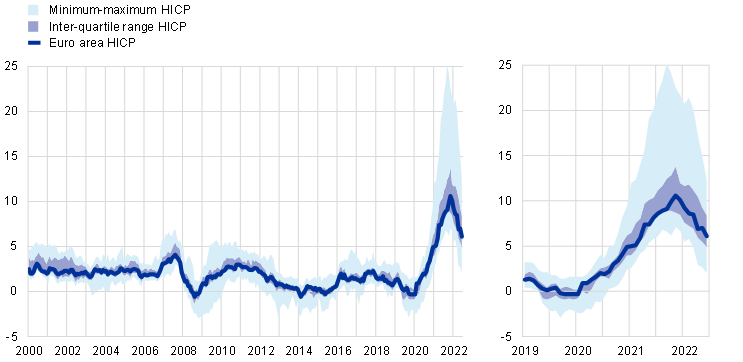
Sources: Eurostat and ECB calculations.
Notes: The inter-quartile range is the difference between the 75th and 25th percentile of the cross-country distribution, with euro area states in changing composition. The minimum-maximum interval corresponds to the lowest/highest inflation growth rate across the euro area countries in each month. The latest observations are for May 2023 (flash estimate).
Persistent inflation differentials may lead to external imbalances. Inflation differentials are normal in a currency union to the extent that they reflect temporary adjustments to shocks or are associated with catching-up processes. In addition, fiscal policy influences inflation differentials in the euro area, including through changes in taxes and public wages.[2] However, if such differentials are not short-lived or do not reflect price level convergence, they may point to diverging cost developments or structural inefficiencies such as nominal and real rigidities in product and labour markets. Persistent inflation differentials could lead to more protracted losses in price competitiveness and a deteriorating current account balance.[3] Such losses in competitiveness can have highly problematic negative externalities and may ultimately need to be addressed by structural policies.
High inflation has spilled over into increasing unit labour costs (ULCs) and unit profits in many euro area countries. An increase in nominal ULCs, defined as compensation of employees per unit of real GDP, is generally considered an important driving factor for a sustained increase in underlying domestic inflation. While the evolution of ULCs has been difficult to interpret in recent years owing to the accounting of job retention schemes and sector reallocation affecting the dynamics of ULCs, it still provides useful signals for assessing the above-mentioned risks of divergences in price competitiveness among the euro area countries and the cost pressures from the labour market.[4] The energy supply shock that has driven inflation since mid-2021 has been accompanied by strong increases in ULCs and unit profit growth. On the one hand, ULCs increased by 8% in the euro area from end-2019 to end-2022, driven by strong increases in compensation per employee, while productivity stagnated. Cross-country heterogeneity has been significant. The strongest increases in ULCs were recorded in the Baltics (up to 28% in Lithuania), Luxembourg and Slovakia. On the other hand, unit profit growth, defined as gross operating surplus and mixed income divided by real GDP, exceeded ULC growth. From an accounting perspective, and according to the GDP deflator, unit profit growth thereby contributed more to domestic inflation than ULC growth.[5] This differential was particularly large in Greece, Latvia, Cyprus, Slovenia, Malta, Germany and Estonia (Chart B). This suggests that the higher input costs, including from imported energy and other intermediate goods, were not buffered by profits and did not have a negative impact on unit profits.[6]
Chart B
Unit profit growth and ULC growth
(x-axis: ULC cumulative percentage change over 2019-2022; y-axis: unit profit cumulative percentage change over 2019-2022; size of bubbles: HICP annual average rate of change in 2022)
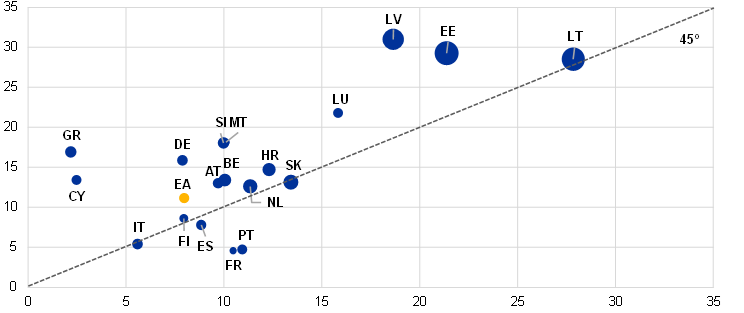
Sources: Eurostat and ECB calculations.
Notes: ULCs are defined as compensation per employee divided by labour productivity. Unit profits are defined as gross operating surplus and mixed income divided by real GDP. Data for Ireland are not included.
Current account developments suggest little progress in the unwinding of imbalances. In the years before the pandemic a process of intra-euro area rebalancing took place in the form of a significant correction of ULCs and an improvement in the current account balances in countries with initial low competitiveness and large net external liabilities. This rebalancing was partial due to large rigidities in labour and product markets before it was interrupted by the pandemic in 2020/2021 and, subsequently, the spike in global energy prices. These developments have led to a deterioration in the current account balance of the euro area, from 2.2% of GDP in 2019 to -1.0% of GDP in 2022. Both deficit and surplus countries were affected. At the end of 2022 the external positions of several countries were below the thresholds defined by the scoreboard indicators of the European Commission’s Macroeconomic Imbalance Procedure (MIP). Cyprus and Greece remain below both the threshold of -35% of GDP for the net international investment position (NIIP) and the current account threshold of -4% of GDP. As for the remaining countries with high external liabilities, the current account is significantly negative in Slovakia, somewhat negative in Portugal and slightly positive in Spain. At the same time, the current account of the main net creditor countries has remained significantly positive, though it has fallen considerably in Germany (Chart C).
Chart C
Current account balance and NIIP
(x-axis: NIIP as a percentage of GDP in the fourth quarter of 2019; y-axis: current account balance as a percentage of GDP, three-year average (2020-2022))
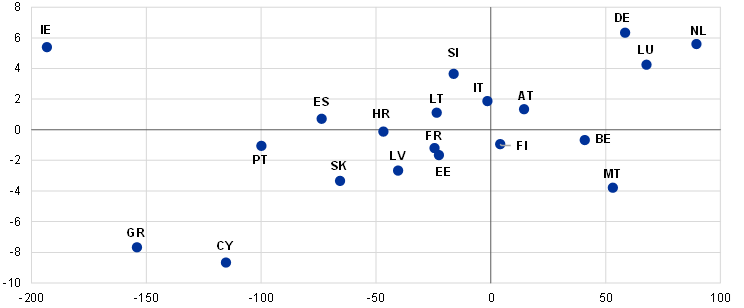
Sources: Eurostat and ECB calculations.
Harmonised competitiveness indicators (HCIs) based on GDP deflators identify broadly the same set of countries with the strongest losses in competitiveness since the start of the pandemic. HCIs provide a broader measure of price competitiveness as they take into account: (i) the exchange rate developments of the euro against euro area countries’ main trading partners, (ii) the relative developments in cost indicators among trading partners, and (iii) developments in trade shares.[7] Changes in the GDP deflator-based HCI from 2019 to 2022 indicate that the Baltics and Luxembourg recorded strong losses in price competitiveness compared with their competitors. For the Baltics, the catching-up process in income levels, commonly known as the Balassa-Samuelson effect, would not constitute a loss of competitiveness and may partly explain the real appreciation.[8]
Overall, changes in price competitiveness since the pandemic appear to have neither aggravated nor further unwound external imbalances. The latest data on HCIs (Chart D) do not give a clear indication of whether the pre-pandemic process of rebalancing will resume. The large net external liability positions of some euro area countries have narrowed since 2019 thanks to higher nominal GDP growth. However, six countries exceeded the MIP threshold of 35% of GDP for the net external liabilities in the last quarter of 2022.[9] To ensure a sustainable rebalancing, further relative price adjustments are necessary. For euro area countries with high net external liabilities, this requires gains in price competitiveness via lower ULC growth and/or lower unit profit growth.
Chart D
NIIP and HCI
(x-axis: NIIP as a percentage of GDP in the fourth quarter of 2019; y-axis: HCI (based on GDP deflators) cumulative percentage change (2019-2022))
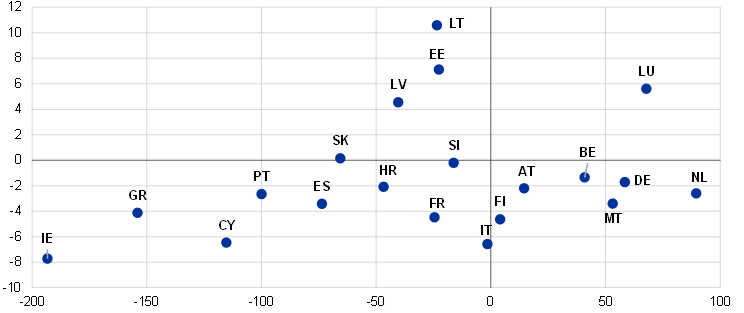
Sources: Eurostat, ECB and ECB calculations.
Notes: The HCIs based on GDP deflators provide an overview of the price competitiveness of each euro area country relative to its own principal competitors in international markets (euro area-20 and effective exchange rate-41 group of trading partners). They are calculated on the basis of weighted averages of bilateral exchange rates against the currencies of the trading partners of each euro area country and are deflated using GDP deflators, which are in some countries affected by the activities of multinational enterprises (Ireland) or special purpose vehicles (Cyprus). Positive values of HCIs denote a loss in price competitiveness; negative values of HCIs denote a gain in price competitiveness. More information on HCIs can be found on the ECB’s Harmonised competitiveness indicators web page.
For more details, see the box entitled “The energy shock, price competitiveness and euro area export performance”, Economic Bulletin, Issue 3, ECB, 2023.
See Checherita-Westphal, C., Leiner-Killinger, N. and Schildmann, T., “Euro area inflation differentials: the role of fiscal policies revisited”, Working Paper Series, No. 2774, ECB, 2023.
See Obstfeld, M. and Rogoff, K., “The unsustainable US current account position revisited”, NBER Working Paper, No 10869, 2004, and Working Group on Econometric Modelling of the European System of Central Banks, “Competitiveness and external imbalances within the euro area”, Occasional Paper Series, No 139, ECB, 2012.
See Giordano, C. and Zollino, F., “Exploring price and non-price determinants of trade flows in the largest euro-area countries”, Working Paper Series, No 1789, ECB, 2015.
See Arce, O., Hahn, E. and Koester, G., “How tit-for-tat inflation can make everyone poorer”, The ECB Blog, ECB, 30 March 2023.
For an analysis on how profits have contributed to inflation in the euro area, see Box 3 entitled “How have profits contributed to the recent pick-up in euro area price pressures?” in the same issue of the Economic Bulletin.
HCIs of the euro area member states are conceptually equivalent to real effective exchange rates of a currency. For more details, see this ECB web page. For this box, the GDP deflator-based measure of the HCI is used since this accounts for the price of all domestically produced goods and services, including the impact of the costs of input additional to labour.
For more details on the impact of the Balassa-Samuelson effect on the euro area economies, see Diaz del Hoyo, J.L., Dorrucci, E., Ferdinand Heinz, F. and Muzikarova, S., “Real convergence in the euro area: a long-term perspective”, Occasional Paper Series, No 203, ECB, 2017.
In Ireland and Cyprus, the NIIP is significantly affected by specific activities of multinational enterprises and special purpose entities without direct links to the domestic economy. Excluding these activities would result in a lower net external liability position.