


Published as part of the ECB Economic Bulletin, Issue 5/2023.
In the context of elevated inflation in the euro area (despite recent declines), it is useful to look at the response of public wages to gauge further pressures on private sector wages and core inflation. While the public sector accounts for only about one-fifth of the economy-wide compensation of employees in the euro area, it can provide a relevant signal for wage negotiations in the private sector. Public wage growth can thus have a bearing on inflation through both a direct channel (aggregate demand) and an indirect channel (as a signal for changes in private sector compensation). This box provides an update on previous analyses of public wage projections for the euro area, including as regards the institutional features that govern public wage-setting across euro area countries.[1] It is based on the June 2023 Eurosystem staff projections and is underpinned by a questionnaire completed by members of the Working Group on Public Finance (WGPF) of the European System of Central Banks.[2]
After having generally grown at rates above inflation since the inception of the euro, public wages took a deep cut in real terms in 2022, but they are expected to partly recover over the projection horizon 2023-25 (Chart A). In the period 2001-21, euro area public wages and compensation per employee grew on average at an annual rate of 2.3%. This was slightly higher than private wage growth (2.0%) and above HICP inflation (1.7%), albeit with differences across periods, especially during crisis episodes. For instance, public wages grew faster than inflation and private wages before and during the global financial crisis and more slowly during the sovereign debt crisis. In 2020, when the coronavirus (COVID-19) crisis hit, public wages continued to grow steadily, reflecting, among other things, bonuses in the health sector.[3] In 2022 euro area public wage growth declined in real terms – by 4.3 percentage points – but a partial catch-up is projected over the period 2023-25, with an average nominal growth rate of 4.1%. Cumulatively over the period 2022-25, nominal public wage growth is still projected to lag inflation by about 2.5 percentage points (with the difference narrowing to below 1 percentage point for the period 2020-25, which includes the impact of the COVID-19 crisis).
Chart A
Euro area public wage growth compared with inflation and other employee compensation indicators
(percentages per annum)
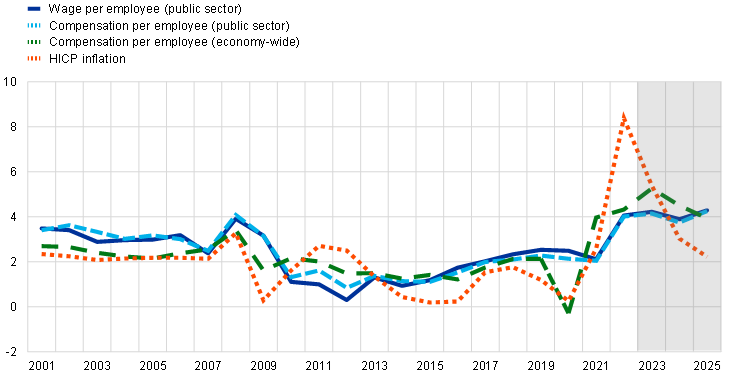
Sources: June 2023 Eurosystem staff macroeconomic projections database and ECB calculations.
Notes: The data on wages and compensation shown in the chart represent annual growth rates. These three euro area aggregates are GDP-weighted averages of country‑specific data. Data on the wage per employee in the public sector (also referred to in this box as “average public wages”) are computed at country level by dividing expenditure recorded under “Wages and salaries” in the Government Finance Statistics database (also referred to in this box as the “public wage bill”) by the number of government employees. Employee compensation reported in government statistics usually includes employers’ social security contributions in addition to wages and salaries.
In terms of institutional arrangements, automatic price indexation of public wages remains relatively limited in the euro area (covering about one‑fifth of the total public wage bill), but there are indications that inflation is increasingly being used as a reference in wage-setting. Updated information based on the WGPF questionnaire indicates that full or partial price indexation continues to be reported in only five countries, representing 19% of the euro area public wage bill in 2022. In two of these countries (Belgium and Luxembourg, covering 5% of the euro area public wage bill), public wages are fully indexed to prices with a backward-looking index automatically linked to the cost of living. In Cyprus and Malta, similar but limited indexation is in place. In Italy, which accounts for the largest share in this group (13% of the euro area public wage bill in 2022), agreements are renewed on the basis of three-year negotiation rounds (with the latest ones being for the periods 2019-21 and 2022-24) and expected inflation excluding energy is used as the reference indicator in wage negotiations, with ex post inflation compensation applied to existing contracts. While in other euro area countries, inflation does not play a formal role in public wage-setting, there are indications that it is increasingly being used as a reference in the process, including in wage negotiations.[4]
In most cases, public wages are set via formal collective public wage agreements, which typically last between one and three years, and are updated in negotiation rounds. Five countries (France, Greece, Latvia, Portugal and Spain), representing close to 40% of the euro area wage bill in 2022, do not have horizontal statutory agreements that apply to the entire government or to specific government sub-sectors. In these cases, public wages are usually updated in the context of budget discussions. Where collective agreements exist, their statutory or customary length varies across countries: one year in Austria, Lithuania and Slovakia; slightly more than one year in Ireland and Slovenia; around two years in Estonia, Finland, Germany, Luxembourg and the Netherlands; two to three years in Cyprus; three years in Italy; and over three years in Croatia and Malta.[5]
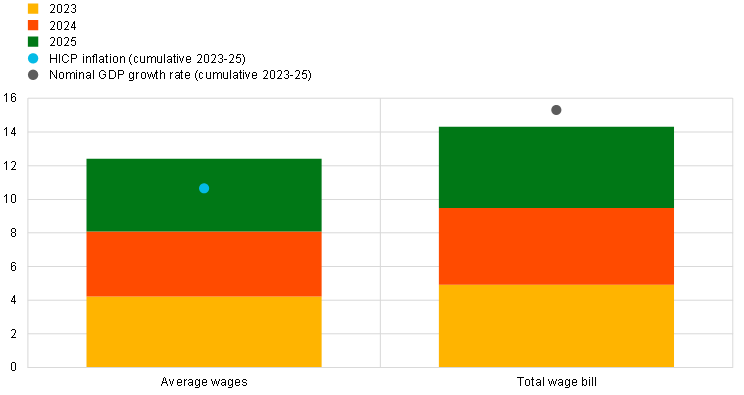
Taking into account the above-mentioned wage-setting schemes and other relevant factors, public wages in the euro area as a whole and in most euro area countries are expected to grow at rates that are cumulatively higher than inflation over the projection horizon (Chart B). At the level of the euro area as a whole and in most euro area countries (16 countries, representing 60% of the euro area wage bill in 2022), average public wages (per employee) are projected to grow at rates above inflation (well above that level in some countries) cumulatively over the period 2023-25. This reflects backward-looking indexation schemes or partial compensation for the cut in real wages in 2022.[6] The euro area’s total public wage bill, which also reflects developments in the number of public employees, is projected to rise at somewhat higher rates (14.3% cumulatively over the period 2023-25, compared with 12.4% for average public wages), albeit somewhat below the nominal GDP growth rate (Chart B, panel a).
Public wage projections reflect substantial heterogeneity at country level, mainly mirroring inflation differentials, but also other factors, such as fiscal positions.[7] In terms of the annual profile, the euro area aggregate hides differences across countries, with several smaller economies with high inflation (for example, the Baltic countries) and those with automatic indexation recording above-average wage growth in 2023. In general, public wage growth is expected to decline in the last year of the projection horizon (2025), reflecting cooling inflation and the fading impact of temporary bonuses in some countries. In a few cases, including where agreements are renewed with a significant lag, as in Italy, wage growth in 2025 is projected to be more substantial than in the preceding years. A simple correlation exercise at country level shows that average public wage growth over the projection period tends to be stronger in countries with higher inflation in 2022 relative to other euro area countries, reflecting backward-looking (partial) inflation compensation (Chart B, panel b, first sub-panel). In terms of grouping by indexation type, projected public wage growth is actually higher on average in countries without automatic price indexation (Chart B, panel b, second sub-panel). This may indicate (i) that countries in this category (particularly the Baltic countries and other more open economies) were more exposed to the inflation shock in 2022 and (ii) that, at high levels, inflation is increasingly being reflected in nominal wage‑setting, even in institutional arrangements where this is not a formal requirement. In terms of grouping by fiscal fundamentals, countries with high levels of government debt seem to be more restrained in granting public wage increases (Chart B, panel b, third sub-panel).[8] Lastly, looking at the fiscal support measures implemented by euro area governments to compensate for the high energy prices and inflation over the period 2021-23, projected public wage growth for the period 2023‑25 is somewhat more restrained in countries with higher levels of such support (Chart B, panel b, fourth sub-panel).
Chart B
Projections of public wages in the euro area for the period 2023-25
a) Growth rates of public wage indicators for the euro area over the period 2023-25
(percentages)
b) Average growth rates of public wages for groups of euro area countries over the period 2023-25
(percentages)

Sources: June 2023 Eurosystem staff macroeconomic projections database and ECB calculations.
Notes: In panel a, the category “Average wages” is the same as that used in Chart A and Chart B, panel b. It includes agreed wages and the wage drift. Agreed wages refer mostly to public wage increases resulting from negotiated wage agreements, where such agreements exist, or similar basic wage increase frameworks. The wage drift is usually calculated as a residual, which conceptually should reflect factors such as: (i) employee career development/promotion scales; (ii) the impact of structural changes and part-time work; and (iii) wages and bonuses outside negotiated wage agreements. Data are shown at the euro area aggregate level (GDP‑weighted averages of country-specific data). In panel b, the data represent simple averages (not weighted by GDP) across countries in the respective groups. In the “Inflation” sub-panel, the “Above EA” (“Below EA”) group comprises countries with an HICP inflation rate that was higher (lower) in 2022 than the euro area (EA) aggregate. In the “Indexation type” sub-panel, Belgium, Cyprus, Italy, Luxembourg and Malta are in the automatic (full or partial) indexation group, with all other euro area countries in the “No formal role for inflation” group. In the “Public debt” sub-panel, countries with government debt above 90% of GDP in 2022 (namely, Belgium, France, Greece, Italy, Portugal and Spain) are in the high-debt group, with the remainder of the euro area countries in the low-debt group. The “Energy/inflation support” sub-panel shows countries in which the cumulative gross fiscal costs of such measures over the period 2021-23, as estimated by the Eurosystem, are above/below the simple euro area average across countries.
Looking ahead, public wages, while not expected to lead to significant second‑round effects, should continue to be monitored closely. At the euro area aggregate level, wage growth in the public sector is projected to remain below that of the private sector over the period 2023-24, but stand somewhat above it in 2025 (for which projections are also surrounded by a higher degree of uncertainty). At the country level, due attention should also be paid over the medium term to the fiscal consequences of increases in public wages by properly balancing macroeconomic stabilisation and fiscal sustainability objectives, especially in countries with high levels of debt and high ageing-related costs.
See, for instance, Checherita-Westphal, C. (ed.), “Public wage and pension indexation in the euro area: an overview”, Occasional Paper Series, No 299, ECB, August 2022. That paper also contains an analysis of the role of public wages in driving private wage dynamics. Based on a review of empirical literature, it concludes that panel studies focusing on euro area countries generally find evidence of a positive relationship between public and private wages, including bi-directional causation. The evidence at individual country level, in particular with regard to causality, is less clear-cut across various studies. Based on various samples of euro area countries, the paper finds a close positive relationship between public and private wages, with the causation going in both directions. Notably, panel regression results point to an increase in average private wage growth of between 0.3 and 0.5 percentage points for a 1 percentage point increase in public wage growth, while controlling for other determinants of private wages.
See the June 2023 Eurosystem staff projections for more details on developments in economy-wide compensation per employee and inflation.
It should be noted that the decline in economy-wide wages in 2020 and their partial rebound in 2021 are distorted by the impact of job retention schemes, which were financed by governments to safeguard private sector employment and do not allow for an accurate comparison with public wage growth.
For instance, in Germany the new wage agreement concluded in April 2023 for the federal and municipal levels of government includes temporary inflation compensation premia of €3,000 per employee, payable from June 2023 to February 2024 (exempt from wage tax and social contributions). The end of these premia in 2024 leads to somewhat lower gross wage increases in 2025. Overall, the agreement provides for pay increases of above 7% in 2023 and almost 5% in 2024. For federal civil servants, it results in pay increases of around 5.5% in 2023 and 4% in 2024.
In the Netherlands, the duration varies across different collective agreements, but is usually between one and two years. In Estonia, the collective wage agreement covers about 15% of public sector employees, as it only applies to the health sector. In Finland, there is no “statutory” length, i.e. the legislation leaves the length of collective agreements open. In practice, agreements often last two years, although there are exceptions. In Malta, collective wage agreements within central government have a much longer duration than in other countries (averaging 5.3 years, with the current civil service agreement running from 2017 to 2024 and covering about 7.5 years). Other entities within Malta’s general government sector have separate collective agreements, which typically cover about three years.
Looking at the remaining countries, the average public wage is projected to grow broadly in line with inflation in Ireland and France, and somewhat below inflation in Greece (as public wages are still frozen in 2023) and Italy (reflecting, among other things, the benchmark indicator used as a reference, namely inflation net of energy).
The Eurosystem’s fiscal projections at country level are, as a general rule, confidential and are therefore not shown in this box.
This correlation holds when the five countries with automatic public wage indexation are excluded from the sample (with the difference between the low-debt group and the high-debt group even increasing). A similar picture (with a somewhat lower correlation coefficient) can be seen when the threshold variable used is the ratio of the budget balance to GDP in 2022.