


Published as part of the ECB Economic Bulletin, Issue 6/2023.
This box analyses the recent dispersion of economic activity across countries and sectors and assesses the role that reopening effects have played following the lifting of coronavirus (COVID-19) restrictions last year. Output growth in the euro area has weakened significantly since the beginning of 2022. This has been accompanied by a declining, albeit persistent, dispersion of growth across countries and sectors. This persistent growth dispersion has reflected a two-speed economy, with relatively subdued growth in manufacturing, partly induced by weaker global demand and tighter euro area financing conditions, and relatively robust growth in services, supported by reopening effects. However, recent survey data suggest that this dispersion may narrow in the near future: while the impulse from reopening effects is weakening, the propagation of other forces across sectors is strengthening.
At the beginning of 2023 the dispersion of growth across euro area countries was still relatively high, while the dispersion of growth across sectors was in line with pre-pandemic levels. To take into account the economic size of countries and sectors, the dispersion of growth is measured on the basis of the weighted standard deviation of year-on-year (real gross) value-added growth in all euro area countries (excluding Ireland) and sectors.[1] Both measures reached unprecedented levels following the outbreak of COVID-19 but declined significantly in 2022, although not at the same rate (Chart A, panel a). In the first quarter of 2023 cross-country growth dispersion remained higher than before the pandemic, while cross-sector growth dispersion returned to pre-pandemic levels. The greater dispersion of growth across countries appears to be related to the continued higher dispersion of growth in contact-intensive services, which declined from the peak recorded during the pandemic but remained at a historically high level (Chart A, panel b).[2] Conversely, cross-country growth dispersion in manufacturing returned to pre-pandemic levels.
Chart A
Dispersion of value-added growth
a) Dispersion of value-added growth across euro area countries and sectors
(percentage points)

b) Dispersion of value-added growth in manufacturing and contact-intensive services across euro area countries
(percentage points)
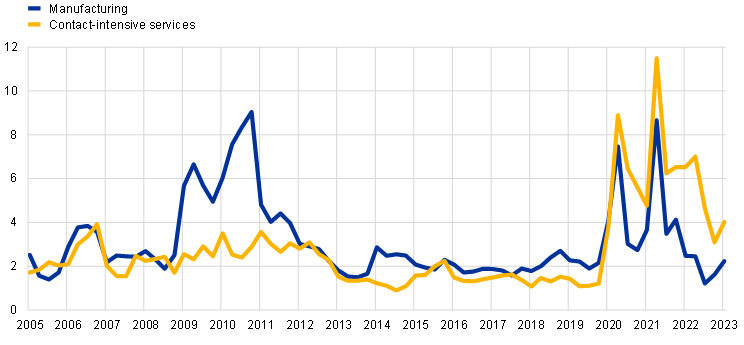
Sources: Eurostat and ECB staff calculations.
Notes: The cross-country growth dispersion is measured as the weighted standard deviation of year-on-year value-added growth in all euro area countries, excluding Ireland. The cross-sector growth dispersion is measured as the weighted standard deviation of year-on-year value-added growth in manufacturing, construction, contact-intensive services and a combination of other sectors. The cross-country growth dispersion in manufacturing and contact-intensive services is measured as the weighted standard deviation of year-on-year sector-specific value-added growth in all euro area countries, except Ireland. The latest observations are for the first quarter of 2023.
In the first quarter of 2023 economic growth remained higher in countries where contact-intensive services are more important for the overall economy. In 2022, contact-intensive services output grew at a stronger pace in countries where these services account for a larger share of the economy (Chart B, panel a). This partly mirrors the growth pattern following the outbreak of the pandemic, when these countries experienced a relatively sharp economic downturn in contact-intensive services. The relatively strong growth in contact-intensive services in countries where these services are more important continued in the first quarter of 2023, with the level of contact-intensive services in these countries exceeding pre-pandemic levels relatively more than in those where contact-intensive services are less important. This shows that countries with a higher dependence on contact-intensive services continued to benefit to a greater extent from the growth impetus in this sector, which also led to relatively higher value-added growth overall (Chart B, panel b). Conversely, countries with a higher reliance on manufacturing mostly experienced lower growth in total value added in the first quarter of 2023, reflecting the somewhat weaker growth of manufacturing compared with contact-intensive services. However, manufacturing growth in euro area countries was far more evenly distributed, suggesting that the current drivers of manufacturing are being exerted more evenly across euro area countries than those of contact-intensive services.
Chart B
Relationship between the size of the contact-intensive services sector and the growth of contact-intensive services and total value added across euro area countries
a) Size of contact-intensive services sector and contact-intensive services value-added growth
(horizontal axis: average share of contact-intensive services value added in total value added in 2022, vertical axis: year-on-year growth of contact-intensive services value added)
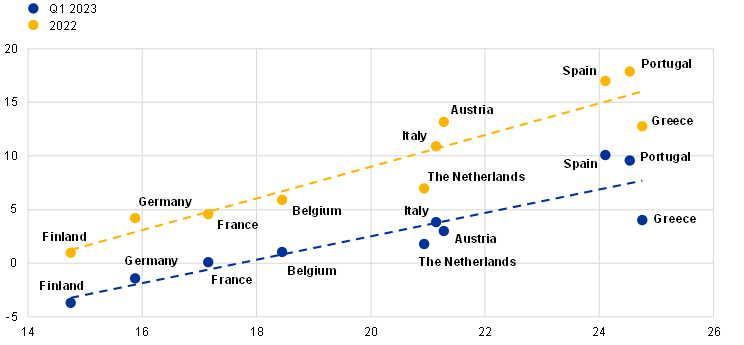
b) Size of contact-intensive services sector and total value-added growth
(horizontal axis: average share of contact-intensive services value added in total value added in 2022, vertical axis: year-on-year growth of total value added)
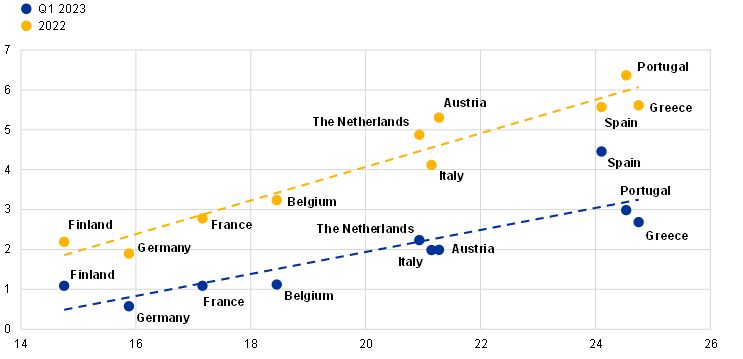
Sources: Eurostat and ECB staff calculations.
Notes: The plots show the ten largest euro area countries (excluding Ireland) – which are important to control as their results are of significance for the euro area as a whole – in line with the calculation of the dispersion of value-added growth (Chart A). Linear trend lines are shown in dashed lines. The year-on-year growth rates for 2022 refer to annual averages of the quarterly annual growth rates in 2022.
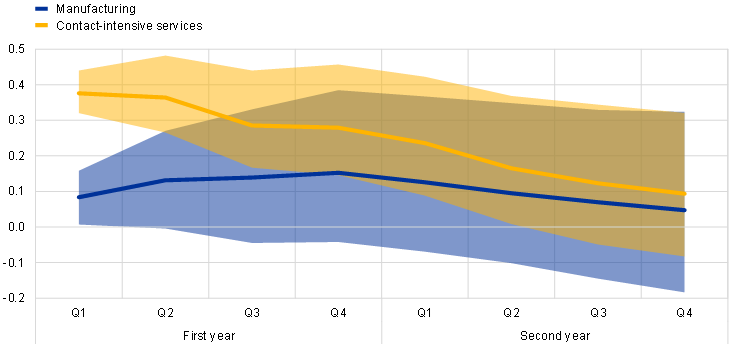
An empirical model shows that unexpected changes in mobility restrictions disproportionately affect contact-intensive services compared with manufacturing. An estimated Bayesian vector autoregression model quantifies the impact of the reopening of the economy on value-added growth in manufacturing and contact-intensive services, based on euro area data from the first quarter of 1999 to the first quarter of 2023. The model uses the composite Google Mobility Index (GMI) to measure the impact of pandemic-related closures and the subsequent reopening of the economy through voluntary and involuntary changes in people’s mobility. The model incorporates this index along with the Federal Reserve Bank of New York’s Global Supply Chain Pressure Index (an indicator of external demand in the euro area), energy prices, value added in manufacturing, contact-intensive services and a combination of other sectors, the private consumption deflator, the interest rate and the exchange rate. The model identifies pandemic-related restrictions and subsequent reopening shocks (i.e. pandemic shocks) by assuming that an unexpected change in the GMI has an immediate impact on manufacturing and contact-intensive services.[3] The results show that an unexpected decline in the GMI (i.e. a pandemic-related restriction shock) leads to a substantial decline in activity in both manufacturing and contact-intensive services, with a larger decline in the latter. Symmetrically, an unexpected increase in the GMI (i.e. a reopening shock) induces a larger rise in contact-intensive services than in manufacturing (Chart C, panel a).
Chart C
Manufacturing and contact-intensive services value added
a) Impact of an unexpected increase in the composite GMI on manufacturing and contact-intensive services activity
(percentages)
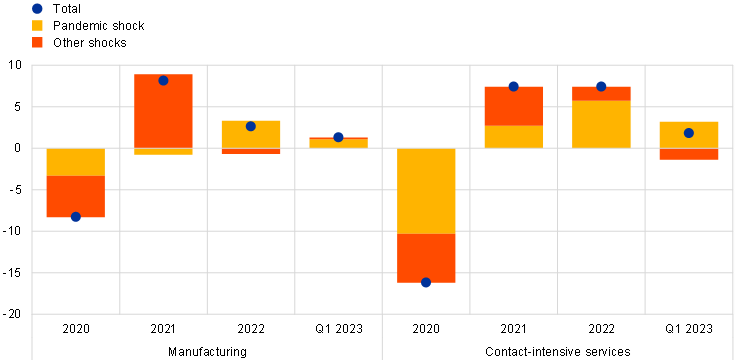
b) Estimated drivers of value-added growth in manufacturing and contact-intensive services
(year-on-year percentage changes and percentage point contributions)
Sources: Eurostat, Google, the Federal Reserve Bank of New York, and ECB staff calculations.
Notes: The results are based on a Bayesian vector autoregression model for the euro area. The pandemic shocks have been identified with a Cholesky decomposition assuming that an unexpected change in the composite GMI has an immediate impact on manufacturing and contact-intensive services. Panel a) shows the effects of an unexpected increase in the GMI (i.e. a reopening shock). The effects of an unexpected decline in the GMI (i.e. a pandemic-related restriction shock) are symmetric to this. The shaded areas in panel a) refer to the 90% confidence bands. In panel b), the estimated contribution of the constant term (i.e. trend growth) is not shown. Moreover, annual growth rates for 2020, 2021 and 2022 refer to annual averages of quarterly annual growth rates. All growth rates are calculated in logarithms.
Reopening effects remained a significant driver of the growth differential between manufacturing and contact-intensive services in the first quarter of 2023 but weakened overall compared with 2022. The model-based decomposition of value-added growth in manufacturing and contact-intensive services suggests that the cross-sector differences in the impact of the pandemic shocks have played a large role in the differences in sectoral performance since 2020, with the shutdown and subsequent reopening of the economy having a larger impact on contact-intensive services (Chart C, panel b). At the start of 2023 reopening effects were still present, albeit with smaller growth impulses for both manufacturing and contact-intensive services compared with 2022. At the same time, other shocks have started to propagate to contact-intensive services and have less of an effect on manufacturing growth. The latter is consistent with easing supply-side constraints; however, these may have been offset by lower global and domestic demand, as well as tighter euro area financing conditions.[4]
Over the course of 2023 the effects of the reopening of the economy should continue to fade and other factors should become more prominent. Due to the gradual fading of reopening effects, as well as the economy-wide propagation of other forces, such as tighter financing conditions, momentum in both manufacturing and contact-intensive services is likely to weaken further in the near future, leading to a decline in growth dispersion across sectors. The waning growth impetus for contact-intensive services should also lead to a decline in the dispersion of growth in contact-intensive services value added, as well as overall economic activity, across countries. Overall, this decline in growth dispersion across sectors and countries reflects a weaker near-term outlook for economic activity, as reflected in the September 2023 ECB staff macroeconomic projections for the euro area.
See also the box entitled “Economic growth in the euro area is broadening”, Economic Bulletin, Issue 1, ECB, 2017.
“Contact-intensive services” is used as shorthand for wholesale and retail trade, as well as transport, accommodation and food service activities (in line with the NACE Rev. 2 classification).
This is achieved by a Cholesky decomposition in which the GMI is placed after the global variables and before the euro area-specific variables. The model includes four lags for each variable, with all variables in logarithms (except for the GMI and interest rates) and controls for the exceptionally high volatility of the data from the first quarter of 2020 to the third quarter of 2020. See Lenza, M. and Primiceri, G., “How to estimate a vector autoregression after March 2020”, Journal of Applied Econometrics, Vol. 37, Issue 4, June/July 2022, pp. 688-699. For the Global Supply Chain Pressure Index, see Benigno, G., di Giovanni, J., Groen, J. and Noble, A., “A New Barometer of Global Supply Chain Pressures”, Federal Reserve Bank of New York Liberty Street Economics, January 2022. The GMI is available for the period from January 2020 to October 2022; it is assumed to be zero for the other periods in the sample, implying in particular that there are no mobility restrictions after October 2022.
Conversely, other shocks explain the more pronounced resilience and faster recovery of manufacturing after the outbreak of the pandemic, which is consistent with the early and strong recovery in global demand for manufacturing goods. This did not, however, fully feed through to manufacturing activity owing to supply chain disruptions and, later, the impact of the energy crisis. Although the shift in global demand from services to goods is related to the pandemic, it is not captured by the identified pandemic shocks per se, as these shocks measure unexpected changes in people’s mobility and do not necessarily capture unexpected changes in their consumption preferences. However, the weaker response of manufacturing relative to contact-intensive services because of an unexpected change in mobility may to some extent be related to a reallocation of people’s consumption from services to goods, thus partially explaining the weaker impact of the mobility shock on manufacturing relative to contact-intensive services value added.