


The inversion of the yield curve and its information content in the euro area and the United States
Published as part of the ECB Economic Bulletin, Issue 7/2023.
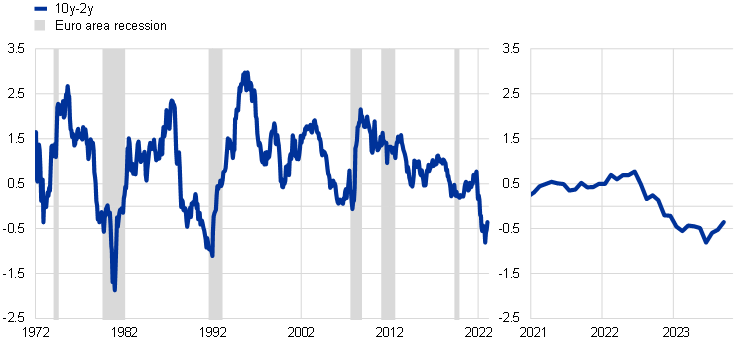
Following the rapid rise in short-term interest rates since last year, the risk-free yield curves in the euro area and the United States show the steepest inversion in decades. The spread between the 10-year and the 2-year Overnight Index Swap (OIS) rates in the euro area stood at -0.4 percentage points in September, after rebounding in recent months from -0.8 percentage points, which was its lowest level since 1992 (Chart A, panel a).[1],[2] In the United States the slope stood at ‑0.6 percentage points for the Treasury curve in September, a level not observed since the early 1980s (Chart A, panel b). The inversion of the slope in both jurisdictions has been driven mainly by a stronger increase in short-term rates relative to longer-term rates. Historically, an inverted yield curve has typically preceded recessions, as illustrated in Chart A. The predictive power of the slope of the yield curve for economic downturns over near-term horizons is well documented, although common econometric models remain silent on the depth and length of a potential recession.[3]
Chart A
Slope of the risk-free yield curves
a) Euro area
(percentage per annum)
b) United States
(percentage per annum)
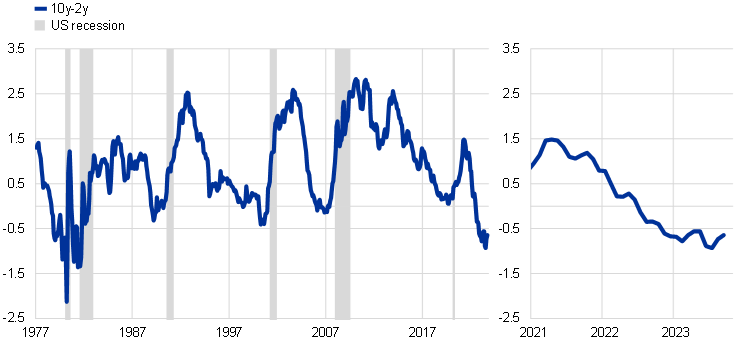
Sources: Bloomberg, Haver Analytics, FRED and ECB staff calculations.
Notes: Panel a): pre-1999 OIS rates are extrapolated using Bund yields. Shaded areas indicate periods of euro area recession as defined by the CEPR-EABCN Euro Area Business Cycle Dating Committee; panel b): the slope is computed using monthly averages of daily data, using 2-year and 10-year Treasury note yields at constant maturity. Shaded areas indicate periods of US recession as defined by the NBER Business Cycle Dating Committee. The latest observations for both panels are for September 2023.
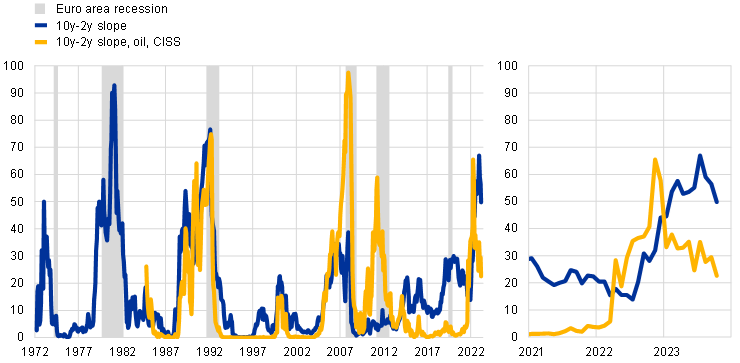
Recession probability models based solely on the yield curve slope currently point to elevated odds of recession in the euro area and the United States in one year’s time.[4] Although its yield curve is less steeply inverted than that of the United States, euro area GDP growth is expected to be subdued in the near term, whereas the US economy remains resilient. Probit models quantify the link between the slope of the yield curve and the likelihood of a near-term recession. A simple model using only information from the slope currently estimates a close to 50% probability of a recession in the euro area in one year (Chart B, panel a, blue line), while the same model for the United States estimates a recession probability of 40%, which is somewhat lower but still the highest in decades (Chart B, panel b).[5]
Chart B
Probability of recession 12-months ahead based on financial indicators and oil prices
a) Euro area
(model probabilities)
b) United States
(model probabilities)
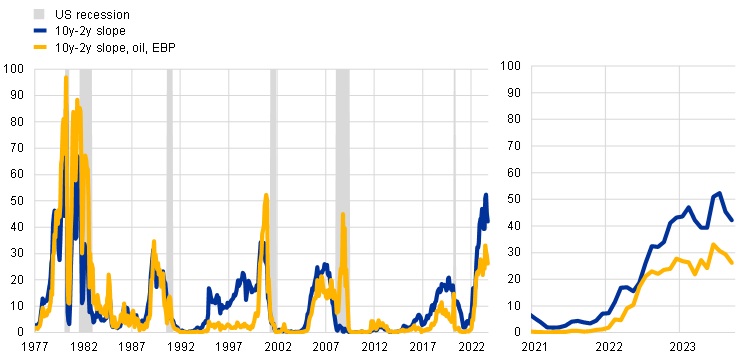
Sources: Bloomberg, Haver Analytics, Refinitiv and ECB calculations.
Notes: Panel a): results of two probit models estimating euro area recession probabilities 12-months ahead. The first model uses only the slope of the yield curve (10y-2y), while the second model includes (linearly-detrended log) oil prices and the level of the euro area Composite Indicator of Systemic Stress (CISS). Bund data extend the sample to before 1999. Shaded areas indicate periods of euro area recession as defined by the CEPR-EABCN Euro Area Business Cycle Dating Committee; panel b): results of two probit models estimating recession probabilities in the United States 12-months ahead. The first model uses only the slope of the yield curve (10y-2y), while the second model includes (linearly-detrended log) oil prices and the excess bond premium (EBP). Shaded areas indicate periods of US recession as defined by the NBER Business Cycle Dating Committee. The latest observations for both panels are for September 2023.
Incorporating additional financial indicators and oil prices into the model suggests lower recession risks amid improved forecasting performance. When the recession probability models are extended to include oil prices as well as the Composite Indicator of Systemic Stress (CISS) for the euro area and the excess bond premium for the United States, their ability to predict recessions improves compared with the simple model.[6] As shown in Chart B, these extended models suggest a lower but still elevated probability of a recession in 12 months, at around 25% in both the euro area and the United States. For the euro area, the lower value reflects the reversal of the sharp increase in the CISS in late 2022 and somewhat lower oil prices relative to the peak levels reached in early 2022, which should dampen growth by less than last year.[7]
Another caveat at the present juncture is the fact that the negative nominal slope is currently driven by the real yield curve, which might weaken the signal of the simple model. Understanding why the yield curve slope is informative with regard to recession risks is challenging, as the slope contains information about monetary policy expectations, risks and views on the macroeconomic outlook, all of which are closely interlinked.[8] However, empirical analysis shows that when decomposing the nominal yield curve slope into market-based inflation compensation and real rates, the slope of the inflation compensation curve is the better predictor.[9] This implies that, in most cases, financial markets priced in an inverted inflation curve, which seems to have anticipated a cooling of the economy. Currently, the negative slope in both the euro area and the United States is mostly driven by an inversion of the real curve rather than by inflation compensation.[10] Given that the model only processes the overall slope, thus representing an average effect, it can be expected to potentially overstate the current risk of a recession.
The effect of the central bank asset portfolios on yields presents a final qualifier for interpreting the message from the inverted yield curve. Asset holdings tend to reduce the slope of the yield curve, which may lead to distorted signals regarding recession risks.[11] Econometric models can be used to correct for the compression in the slope of the term premia induced by the ECB’s asset purchase programme and the pandemic emergency purchase programme.[12] The adjusted slope of the euro area risk-free curve would have remained positive for longer but would have still reached slightly negative values early in the summer. This implies that the latest readings of the non-adjusted yield curve slope might further overestimate recession probabilities.[13] The distortion of the recession risk signal derived from the slope of the yield curve will generally become smaller over time as the balance sheet policies of the ECB and the Federal Reserve System are unwound. However, uncertainty about the size of this effect is high, particularly as quantitative tightening makes estimating the distortion even more challenging than in the phase of balance sheet expansion.
The literature has considered various maturities for the slope, but we find little statistical difference in predictive performance for different choices for the euro area.
Euro area OIS spot rates before 1999 are backcasted using Bund yields. Results are robust to using Bund yields for the entire sample, as the predictive power in the euro area is found to be driven by core countries; see Sabes, D. and Sahuc, J. G., “Do yield curve inversions predict recessions in the euro area?”, Finance Research Letters, Vol. 52, 2023.
The predictive power of the slope of the yield curve is documented for the euro area and the United States, as well as for other advanced and emerging market economies. One of the earlier leading papers in the literature is Estrella, A. and Hardouvelis, G. A., “The term structure as a predictor of real economic activity”, The Journal of Finance, Vol. 46, No 2, 1991, pp. 555-576. For more recent surveys, see Haubrich, J. G., “Does the Yield Curve Predict Output?”, Annual Review of Financial Economics, Vol. 13, 2021, pp. 341-362, and De Backer, B., Deroose, M. and Van Nieuwenhuyze, C., “Is a recession imminent? The signal of the yield curve”, NBB Economic Review, 2019. Sabes, D and Sahuc, J. G., op. cit., finds that the lead time is six months to one and a half years for the euro area, Germany, France, Italy and Spain.
This analysis focuses on the 12-month horizon, which provides an indicative benchmark. However, estimated probabilities vary depending on the horizon.
For benchmarking, the probability of a euro area (US) recession in one year with a zero slope is 36% (22%). However, comparing estimated recession probabilities across the two jurisdictions is not straightforward. A negative slope sends a much stronger signal for recession than a low but positive slope because of the non-linear nature of the probit model. The performance of the euro area nominal slope in predicting recessions is robust to controlling for the level of interest rates (i.e. including the 3-month interest rate), which is in line with results for the United States (see Bauer, M. D. and Mertens, T. M., “Information in the yield curve about future recessions”, FRBSF Economic Letter, Vol. 20, 2018). We use euro area recessions as defined by the CEPR-EABCN Euro Area Business Cycle Dating Committee, and US recessions as defined by the NBER Business Cycle Dating Committee.
When assessed using the same sample period, goodness-of-fit statistics are significantly improved in the extended model, as the model interprets higher oil prices and higher systemic stress as strong predictors of a recession. Chart B, panel a) illustrates that the extended model better anticipates the euro area recessions of 2008 and 2011, which were preceded by high values for both variables. For further discussion of potential improvements to yield curve-based recession probability models, see Ferrari Minesso, M., Lebastard, L. and Le Mezo, H., “Text-Based Recession Probabilities”, IMF Economic Review, Vol. 71, No 2, 2023, pp. 415-438.
We have also estimated the extended model on a shorter sample that ends before the COVID-19 pandemic, since the economic meltdown following March 2020 was unpredictable from the perspective of the yield curve. Specifically, the extended model for the euro area indicates a probability closer to 15% (compared to 25% in the full sample), while the results are almost unchanged for the United States.
The risk-free curve captures information on expectations for current and future monetary policy and how it relates to the macroeconomic outlook and the compensation required by market participants for bearing interest rate risk stemming from the uncertainty surrounding both future inflation and real rates, i.e., nominal term premia. A negative slope may therefore reflect investors’ expectations that the macroeconomic outlook will worsen, inflation will decline and yields will be lower as growth slows and monetary policy loosens in response. It could also reflect expectations of overtightening and rapid course reversion. A number of other mechanisms could also be at play, such as the expected profitability channel lowering the supply of credit and constraining growth as a negative slope hampers bank profitability by reducing the spread between rates on short-term deposits and long-term loans (see Minoiu, C., Schneider, A. and Wei, M., “Why Does the Yield Curve Predict GDP Growth? The Role of Banks”, Finance and Economics Discussion Series, Vol. 49, 2023).
For the documented results for the United States, see Ajello, A., Benzoni, L., Schwinn, M., Timmer, Y. and Vazquez-Grande, F., “Monetary policy, inflation outlook, and recession probabilities”, FEDS Notes, 2022, and Neely, C., “What is the probability of a recession? The message from yield spreads”, On The Economy Blog, Federal Reserve Bank of St. Louis, 7 September 2023. We obtain our results with decompositions since 1992 for the euro area and since 2004 for the United States. The results for the euro area are based on euro area inflation-linked swap (ILS) rates since 2005 and backcasted market-based real rates and inflation compensation measures between 1992 and 2005. For more details, see the box entitled “Backcasting real interest rates and inflation expectations – combining market-based measures with historical data for related variables”, Economic Bulletin, Issue 2, ECB 2023. These results, while suggestive, therefore warrant additional caution, as they are based on smaller samples, have few periods of high inflation and, in the case of the euro area, rely on less precise measures of inflation compensation in the early part of the sample.
Note that the slope referred to here is the 10-year minus 2-year, and that inflation compensation has already priced in a significant decline of inflation towards target levels over the next two years.
For more details, see the box entitled “US yield curve inversion and financial market signals of recession”, Economic Bulletin, Issue 1, 2020, and Bauer, M. D. and Mertens, T. M., op. cit.
See Eser, F., Lemke, W., Nyholm, K., Radde, S. and Vladu, A. L., “Tracing the impact of the ECB’s asset purchase programme on the yield curve”, International Journal of Central Banking, Vol. 19, No 3, 2023.
Using the estimated coefficients for the probit models with the slope of the yield curve adjusted for asset purchases would decrease the estimated probability of a recession in the euro area in 12 months to around 35% (compared with 50%) for the baseline model and 15% (compared with 25%) for the extended model.