


Published as part of the ECB Economic Bulletin, Issue 7/2023.
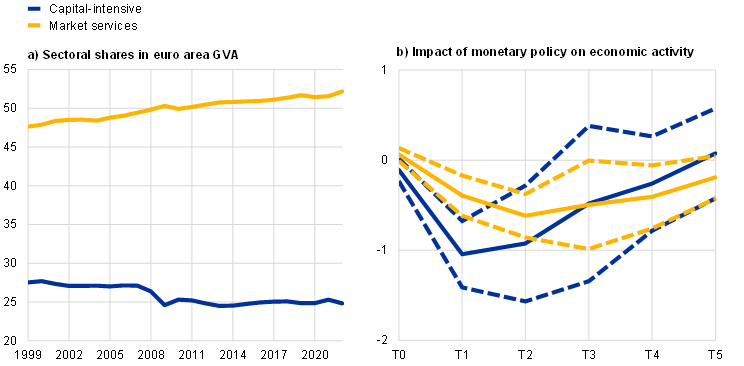
The service intensity of the euro area economy has increased since the launch of the euro. Between 1999 and 2022, the share of market services in euro area gross value added (GVA) has risen by around 4½ percentage points, from somewhat below 48% to more than 52% (Chart A, panel a). Over the same period, the GVA share of industry (including manufacturing) and construction – typically regarded as relatively capital-intensive sectors – has declined by around 2½ percentage points from around 27½% to around 25%.
Chart A
GVA of capital-intensive and market services sectors – evolution and response to monetary policy
(percentages)
Sources: Eurostat and authors’ calculations.
Notes: Panel a): the market services sector includes, among others, wholesale and retail trade, transportation, accommodation and food services, information and communication, and financial and real estate services. The capital-intensive sector includes, among others, mining, manufacturing, energy and water supply, and construction. Panel b) shows the impact of a 25 basis point policy rate hike over a period of five years (T0 to T5). The broken lines indicate 90% confidence intervals.
This box provides new analysis of whether the service intensity of an economy matters for the real transmission of monetary policy. Empirical evidence suggests that the sectoral composition of output has implications for the impact of monetary policy owing to, for example, the higher interest-rate sensitivity of more capital-intensive industries.[1] This analysis uses a fine geographical breakdown of the level and composition of economic activity in the euro area. The data are taken from the European Commission’s ARDECO[2] database and refer to the most granular regional disaggregation available (NUTS3, which roughly corresponds to cities and counties). The granularity of the data offers two advantages for an econometric analysis of the implications of an increased service intensity for the transmission of monetary policy. First, a host of confounding factors that typically complicate the identification of monetary policy effects at the macro level can be incorporated. Second, the residual variation in the level and composition of economic activity at the regional level remains substantial even after controlling for these macro factors. The local projections method is used to estimate the dynamic impact of exogenous changes in monetary policy on regional economic activity.[3]
How observed sectoral shifts affect the transmission of monetary policy is analysed in two steps. First, the effects of monetary policy on GVA in services are compared to the corresponding effects in manufacturing and construction (the capital-intensive sector). Second, the interaction between service intensity and the transmission of monetary policy to overall GVA is estimated. The first step checks for heterogeneity in the response patterns of different types of activity and thus analyses whether monetary policy transmission is different across sectors of the economy. The second shows how relevant this heterogeneity is in shaping the real effects of monetary policy, i.e. to what extent the sectoral composition of the economy affects monetary policy transmission.
The impact of monetary policy on services is significant, albeit weaker and slower than the impact on manufacturing and construction. The response of services becomes visible in the year following the monetary policy shock and, for a 25 basis point tightening, it reaches a trough of around 0.6% in the second year (Chart A, panel b, yellow line).[4] Thus the services response is weaker and more delayed than the response in manufacturing and construction, which reaches its trough in the first year and contracts by around 1% (blue line).[5] This difference is plausible in view of the stronger impact that the interest rate channel of monetary policy has on the more capital-intensive areas of economic activity, and it is qualitatively consistent with related analyses at the aggregate level.[6] At the same time, the estimates confirm that services respond in a statistically and economically significant manner to monetary policy shocks, reflecting the fact that (i) services also often require non-negligible capital inputs and (ii) monetary policy is also transmitted via channels other than the interest rate sensitivity of capital.[7]
Thus a higher service intensity dampens monetary policy transmission to the real economy in the shorter term, but this dampening effect is moderate. Consistent with the heterogenous responses across sectors, the impact of monetary policy on GDP becomes weaker as the service intensity of the economy increases (Chart B). The effect is statistically significant for roughly two years after the shock, and, at its peak in year 2, it weakens the real effect of a 25 basis point monetary policy tightening by around 1 basis point for every percentage point that is added to the services share. The observed increase in the services share of the euro area economy since the launch of the euro is around 4½ percentage points, implying a dampening impact of around 4 basis points. This is below 10% of the maximum response of GDP to the same shock.[8]
Chart B
Effect of higher service intensity on monetary policy transmission
(percentages)
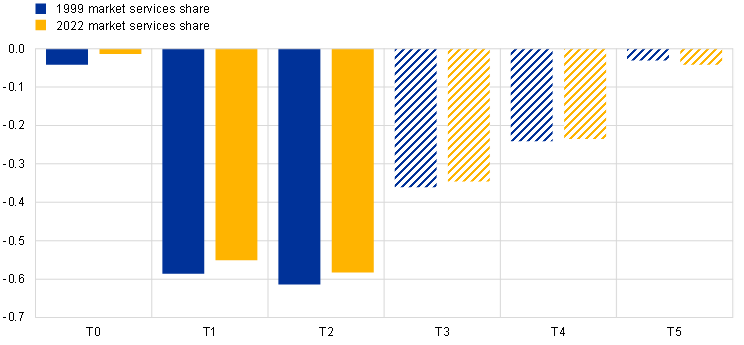
Sources: ECB, Eurostat and authors’ calculations.
Notes: The chart shows the impact of a 25 basis point policy rate hike over a period of five years (T0 to T5), conditional on the services shares prevailing in 1999 and 2022 respectively. This corresponds to the sum of the slope coefficient of the monetary policy rate and the coefficient of an interaction term between the monetary policy rate and the services share. Otherwise, the specification is identical to equation 1 in Hauptmeier, S., Holm-Hadulla, F. and Nikalexi, K., op. cit. Solid bars indicate that the effects are significant to at least a 10% level.
See, for example, Carlino, G. and DeFina, R., “The Differential Regional Effects of Monetary Policy”, The Review of Economics and Statistics, Vol. 80(4), November 1999, pp. 572-587; and Peersman, G. and Smets, F., “The Industry Effects of Monetary Policy in the Euro Area”, The Economic Journal, Vol. 115(503), April 2005, pp. 319-342.
ARDECO is the “Annual Regional Database of the European Commission”.
For details on data and methodology, see Hauptmeier, S., Holm-Hadulla, F. and Nikalexi, K., “Monetary policy and regional inequality”, Working Paper Series, No 2385, ECB, March 2020.
The model is symmetric, so analogous results apply to a monetary policy easing.
A potential limitation is that each of the two sectors (capital-intensive and services) covers a diverse set of economic activities, which in turn may differ in their responsiveness to monetary policy. Breaking these groups down further, the main results described in this box remain intact. However, the most granular breakdown publicly available at regional level still lumps, for instance, accommodation and food services together with transportation and storage, which would typically exhibit quite different capital intensities.
Other factors have also seen major changes over the lifetime of the euro and could imply cross-sectoral heterogeneity in transmission. For instance, increased household debt levels might have made monetary policy more powerful (see, for example, Kim, Y. and Lim, H., “Transmission of monetary policy in times of high household debt”, Journal of Macroeconomics, Vol. 63, March 2020).
For instance, the combination of imperfect competition and price rigidities may give rise to stronger real effects of monetary policy in the non-tradable sector (which tends to be made up chiefly of services); see Lane, P.R., “Inflation in open economies”, Journal of International Economics, Vol. 42(3-4), May 1997, pp. 327-347.
For further evidence on the limited role of service intensity in shaping the real transmission of monetary policy, see Coeuré, B., “The rise of services and the transmission of monetary policy”, speech at the 21st Geneva Conference on the World Economy, May 2019.