
EU emissions allowance prices in the context of the ECB’s climate change action plan
Published as part of the ECB Economic Bulletin, Issue 6/2021.
In its climate change action plan, the ECB committed to accelerating the development of new models and conducting theoretical and empirical analyses to monitor the implications of climate change and related policies for the economy.[1] As a first step in its detailed roadmap of climate-related actions, the ECB envisages the inclusion of technical assumptions on carbon pricing in Eurosystem/ECB staff projections.[2] Complementing the current technical assumptions in this way will provide the basis for expanding economic models used in the projections. Against this backdrop, this box summarises the genesis and basic features of the EU emissions trading system (ETS), the system setting the carbon price in the EU.
The EU ETS is the market on which EU emissions allowances – each giving the holder the right to emit one tonne of carbon dioxide (CO2) equivalent – are traded. It constitutes a key EU policy tool for cutting greenhouse gas (GHG) emissions, covering approximately 10,000 companies in the power sector and manufacturing industry as well as airlines operating between airports located in the European Economic Area (EEA). All in all, around 40% of the EU’s GHG emissions are subject to the EU ETS. In July 2021, a revision of the EU ETS was proposed in the context of the ambitious “Fit for 55” package, which aims – together with other policy measures – to cut 55% of all GHG emissions by 2030 compared with 1990 levels.[3]
The EU ETS is a “cap and trade” system, where a cap is set on the total amount of GHGs that can be emitted annually by the economic actors covered by the system. The level of the cap determines the number of emissions allowances available in the system and is being reduced over time with the aim of enforcing a gradual decline in emissions and achieving carbon-neutrality by 2050. Within the limits set by the cap, emissions allowances are allocated to participants either for free or through auctions. Each year, corporations and other economic entities must “return” one allowance for every tonne of CO2 equivalent they emit that year. If a participant’s emissions exceed its allocated allowances, it must purchase additional allowances on the EU ETS market. Conversely, if a participant reduces its emissions to below its permitted/allocated levels, it can either keep its surplus allowances to cover future needs or sell these on the EU ETS market.[4]
The EU ETS began operating in 2005 and has been implemented in different “phases”, gradually reducing the cap while increasing the scope of the system – geographically, by sector and by type of GHG emissions covered (Table A).[5] While the first two phases were characterised by a large number of free allocations and often also by demand-supply mismatches, in particular due to the great financial crisis starting in 2008, the two more recent phases were accompanied by an increase in the share of auctioned rather than allocated allowances, a harmonisation of rules, a reduction in the annual emissions cap, and market reforms to adjust for oversupply through a backloading of excess allowances, meaning a postponement of auctions without reducing the total number of allowances to be auctioned, and the absorption of allowances into a Market Stability Reserve (MSR). In this respect, the revised EU ETS Directive[6] announced in 2018 entailed a substantial reduction in the emissions allowance surplus.
Table A
The four phases of the EU ETS

The price of emissions allowances traded on the EU ETS has increased from €8 per tonne of CO2 equivalent at the beginning of 2018 to around €60 more recently (Chart A). Important medium-term price drivers have included the introduction of the MSR and a faster reduction in the number of EU emissions allowances available to businesses covered by the EU ETS. Also, as mentioned above, the 2018 revision of the EU ETS Directive – which set the framework for the fourth trading period from 2021 to 2030 – appears to have increased the credibility of the scheme. More recently, a perceived shift towards more stringent climate policies globally and the likelihood of an earlier end to the free allocation of emissions allowances, as outlined in the “Fit for 55” package, are likely to have contributed to price increases. The announcement of the European Green Deal[7] and subsequent postponements of EU ETS auctions in 2021 also supported higher prices. Beyond these market design changes, the price surge may also reflect a rise in energy demand due to weather patterns and a re-opening of the economy following the ending of coronavirus (COVID-19) pandemic-related restrictions, as well as speculation by some market actors who are taking long positions in the EU ETS market in anticipation of further price increases over the coming months. So far, futures prices have been relatively flat, albeit sloping slightly upward. The main reason for this is that surplus allowances can be kept to cover future needs, creating a strong link between spot and futures prices. The cost of storing such allowances is small and there is no apparent benefit to holding allowances as there is for physical commodities. Therefore, the main difference between a spot and a future emissions allowance is the opportunity cost of money paid for the spot allowance.[8]
Chart A
EU emissions allowances – ETS spot and futures prices
(EUR per metric tonne)

Sources: Refinitiv, Bloomberg and ECB calculations.
Notes: Yearly EU ETS futures prices are calculated as averages of the quarterly futures prices for any given year. Latest observation: August 2021 for EU ETS spot prices (monthly data) and December 2023 for EU ETS futures prices (quarterly data).
So far, emissions allowance prices are likely to have affected only HICP energy inflation – in particular electricity prices – owing to free allowances in other sectors and the still limited sector coverage. In 2020, across countries, the majority of allowances for industrial installations in the manufacturing sector and EEA aviation were allocated effectively for free, while the majority of emissions allowances for fossil fuel combustion were auctioned (Chart B). The recent spike in emissions allowance prices is seen as one cause of recent increases in electricity prices in some euro area countries. This is particularly the case where electricity prices are not, or only partly, regulated and where households opt for variable tariffs.[9] In other countries, electricity prices are likely to react with a delay due to price regulation or are less affected due to the use of low-carbon electricity generation.[10] In the longer term, the direct impact of emissions allowance prices on inflation will also depend on the pace of decarbonisation, including the transition from electricity produced using carbon-intensive fossil fuels to electricity from carbon-neutral sources. According to Eurostat data, the share of fossil fuels used in electricity generation in the EU decreased from around 45% in 2018 to 40% in 2020, but the share varied substantially across countries. However, this year, coal-fired electricity generation has increased, despite the rise in emissions allowance prices, which probably reflects the currently high gas prices. Overall, the risk that emissions allowance prices under the current EU ETS may translate into significantly higher headline inflation in the near term appears limited, because so far mainly HICP energy has been affected.
Looking forward, in line with the ECB’s recently announced action plan, these and other climate change mitigation polices will need to be further explored with regard to their implications for inflation and output. This will require the further development of macroeconomic modelling, which will be essential to support the conduct of monetary policy.
Chart B
Allocated emissions allowances and remaining emissions for which allowances need to be purchased, by sector
(million tonnes CO2 equivalent, 2020)
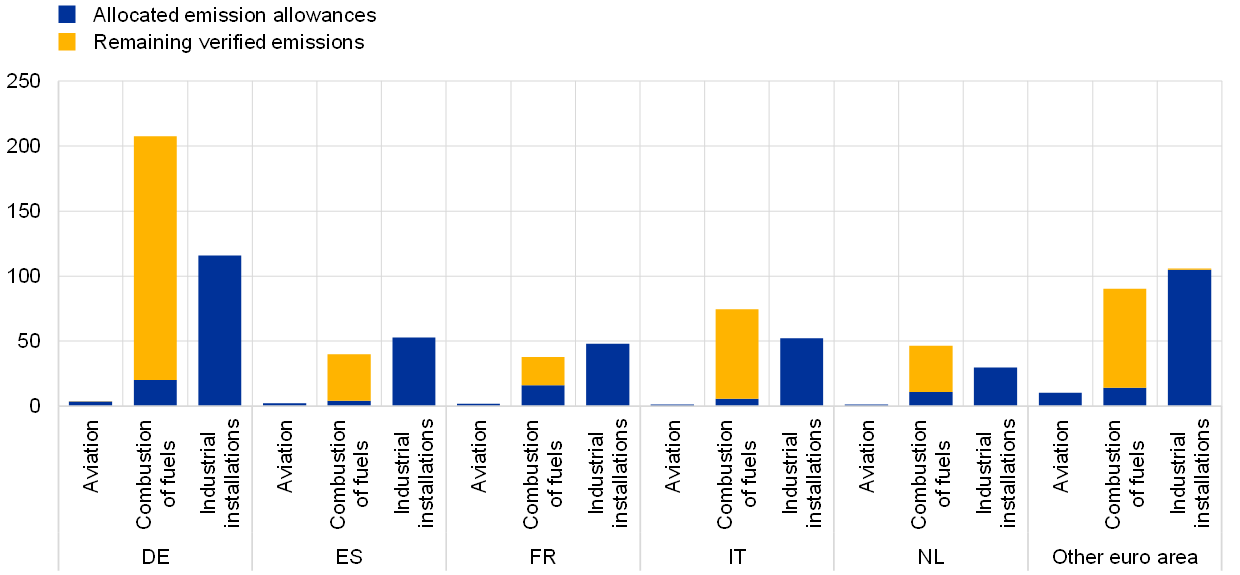
Sources: European Environment Agency and ECB calculations.
Notes: Remaining verified emissions are calculated as total verified emissions minus allocated emissions allowances. Emissions from industrial installations are the sum of emissions from all included industrial sectors. The coverage of verified emissions by allocated allowances varies between industrial sectors: some sectors’ emissions are not fully covered by their allocated allowances, while other sectors’ emissions are below their allocated allowances.
- See “ECB presents action plan to include climate change considerations in its monetary policy strategy”, press release, ECB, 8 July 2021. Please also see “Climate change and monetary policy in the euro area”, Occasional Paper Series, No 271, ECB, September 2021, which summarises staff input into the Governing Council’s deliberations in the context of the ECB’s monetary policy strategy review.
- See “Detailed roadmap of climate change-related actions”, annex to the ECB press release presenting its action plan to include climate change considerations in its monetary policy strategy, ECB, 8 July 2021.
- See Commission Communication “‘Fit for 55’: delivering the EU’s 2030 Climate Target on the way to climate neutrality” (COM(2021)/550 final) for an overview of the package; and Proposal for a Directive of the European Parliament and of the Council amending Directive 2003/87/EC establishing a system for greenhouse gas emission allowance trading within the Union, Decision (EU) 2015/1814 concerning the establishment and operation of a market stability reserve for the Union greenhouse gas emission trading scheme and Regulation (EU) 2015/757 (COM(2021)/551 final) for the proposed revisions to the EU ETS.
- For more detailed information on the EU ETS, see the Carbon Market Reports published annually by the European Commission.
- For more information on the development of the EU ETS, see “Development of EU ETS (2005-2020)”, European Commission.
- Directive (EU) 2018/410 of the European Parliament and of the Council of 14 March 2018 amending Directive 2003/87/EC to enhance cost-effective emission reductions and low-carbon investments, and Decision (EU) 2015/1814 (OJ L 76, 19.3.2018, p. 3). See also Directive 2003/87/EC of the European Parliament and of the Council of 13 October 2003 establishing a scheme for greenhouse gas emission allowance trading within the Community and amending Council Directive 96/61/EC (OJ L 275, 25.10.2003, p. 32).
- See “A European Green Deal”, European Commission.
- There is the possibility that the slope of the curve may shift in the future. This could happen, for example, if the currently slightly negative convenience yield turned more negative. This might be the case if holders of physical allowances were concerned about changes to the rules which reduce the value of physical allowances, but not the value of futures contracts. A concern which some market participants appear to have in this respect is that regulators could restrict the right to carry over allowances from one year to the next. See also Bredin, D. and Parsons, J., “Why is Spot Carbon so Cheap and Future Carbon so Dear? The Term Structure of Carbon Prices”, The Energy Journal, Vol. 37, No 3, 2016.
- See Pacce, M., Sánchez, I. and Suárez-Varela, M., “Recent developments in Spanish retail electricity prices: the role played by the cost of CO2 emission allowances and higher gas prices”, Occasional Paper, No 2120, Banco de España, 2021.
- The share of electricity generated from low-carbon renewable or nuclear energy varies substantially between different euro area countries, and consequently also the share of electricity produced from fossil fuels. See, for example, Energy, transport and environment statistics, Eurostat, 2020.