


Update on euro area fiscal policy responses to the energy crisis and high inflation[1]
Published as part of the ECB Economic Bulletin, Issue 2/2023.
This box provides updated estimates on the fiscal support provided by euro area governments in response to the energy crisis and high inflation, reflecting the March 2023 ECB staff macroeconomic projections.[2] It updates the budget balance cost of the discretionary energy and inflation compensatory measures to reflect the latest developments in energy prices and changes in fiscal policy since the December 2022 Eurosystem staff macroeconomic projections. It also provides more granular information on the design and timing of these fiscal policy support measures. This includes an assessment of the energy price caps and the quarterly profile of the measures, which help to give a more accurate indication of the transmission of such measures to inflation.[3]
According to the March 2023 ECB staff macroeconomic projections, the discretionary fiscal support enacted by euro area governments in response to the energy crisis and high inflation remains sizeable in 2023 (Chart A). This fiscal support is estimated to amount to around 1.8% of euro area GDP in 2023 (down from 1.9% in 2022) and to drop steeply to 0.5% of GDP in 2024. Prior to Russia’s invasion of Ukraine, euro area energy support was relatively limited and confined to a few countries. However, following the surge in energy prices in 2022, energy support measures were adopted by all euro area countries, although the size of the measures differed considerably across member states. Such measures mainly took the form of reduced indirect taxes and increases in subsidies, mostly in relation to energy products, as well as transfers to households. In autumn 2022, when governments drafted their budget plans for 2023 – which were underpinned in some countries by multi-annual government strategies – the measures were further expanded into the last quarter of 2022 and into 2023, with some support measures having effects over the period 2024-25. Moreover, significant price cap measures were approved in some countries, in particular in Germany (with deficit effects primarily in 2023) and the Netherlands (effects limited to 2023). In other countries, such measures were extended, for example in France (to 2023, with some effects also estimated in 2024) and, to a lesser extent, in Spain (to 2023).
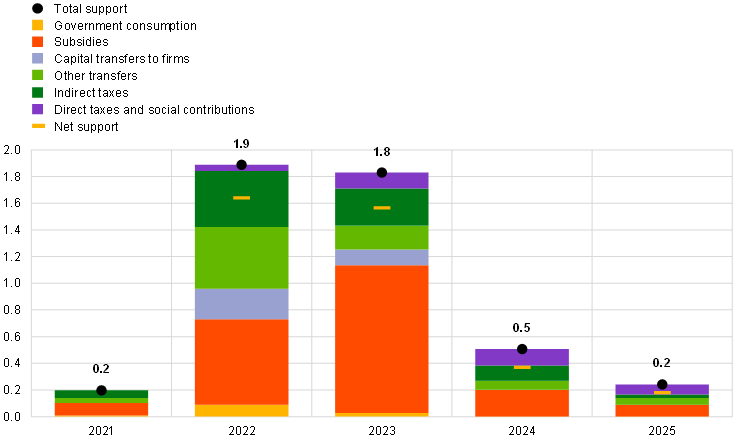
Chart A
Euro area discretionary fiscal policy support measures in response to the energy crisis and high inflation
a) Size of support and composition by fiscal instrument over the projection horizon
(percentages of GDP)
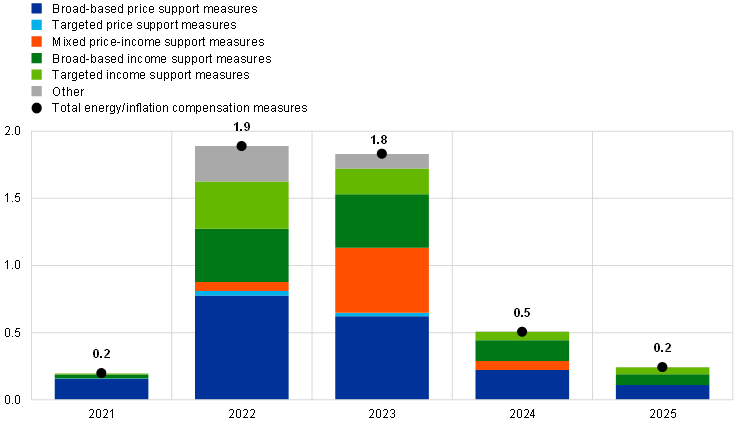
b) Decomposition of measures based on the channels through which they affect inflation
(percentages of GDP)
Sources: ECB staff calculations based on the March 2023 ECB staff macroeconomic projections and updates to the fiscal questionnaires provided by the ESCB Working Group on Public Finance (WGPF).
Notes: In Panel a), the size of the bars denotes the fiscal support with impact on the budget balance in gross terms. “Net support” refers to the gross budget support adjusted for discretionary financing measures (mostly taxes on energy sector windfall profits). “Other transfers” mostly refers to transfers to households. In Panel b), the distinctions between income support and price support measures, as well as between targeted measures and broad-based measures are explained in the article entitled “Fiscal policy and high inflation” in this issue of the Economic Bulletin. The category “Mixed price-income support measures” refers to fiscal policy support measures that cannot be clearly distinguished as either income or price support. This relates mostly to the German energy price brakes, which are of a mixed nature in that the measures are recorded in principle as income support, but also have effects on HICP. The category “Other” includes government purchases to fill gas storage, capital transfers to support liquidity of firms and any other residual items.
Compared with the December 2022 Eurosystem staff projections, the euro area total gross fiscal support in response to the energy crisis and high inflation has been scaled down for 2023, albeit only by 0.14 percentage points when looking at the year as a whole. The reason for the observed stickiness in the budgeted fiscal cost of energy measures is that only about 43% of such fiscal support in 2023 is linked directly to energy prices via energy price caps. The remainder represents standard measures such as subsidies, indirect tax cuts and transfers to households, which do not usually have an explicit link to market energy prices. This means that such measures are either rolled back on the basis of a discretionary decision or remain in place. Moreover, it would be difficult to reassess their actual budget impact in real time. The extent of the pass-through from wholesale energy prices to the fiscal cost of price cap measures differs from country to country. It depends on three main factors: (i) the lag with which wholesale prices affect consumer (retail) energy prices (the longer the lag, the later the fiscal costs react); (ii) the specific design of measures (for example, based on past versus current energy consumption); and (iii) the prevailing structure of energy contracts in each country (at fixed versus flexible price). Among the five largest euro area economies, the pass-through from wholesale prices to fiscal costs is estimated within the same year to be high in the Netherlands and low in Germany and France, while price cap measures with a direct budget balance effect are relatively limited in Spain and are not in place in Italy, at least for the time being. Finally, the stickiness in the cost of fiscal support for 2023 at euro area aggregate level can also be explained by the fact that the estimates for some countries have been revised upwards since the December 2022 projections in the light of new information included in the final budget laws, including extensions of support measures into 2023.[4]
As illustrated in Chart A, panel b), these energy/inflation compensation measures affect inflation via two main channels:
- Direct price effects. Temporary fiscal measures with a direct impact on the marginal cost of energy consumption reduce short-term inflationary pressures. Such measures may also favour wage moderation and thus limit the second-round effects of energy price hikes. Measures in this group fall into two main categories:
- indirect tax cuts and equivalent measures, such as reductions in energy network fees. These measures lower prices upon enactment and have reverse effects when withdrawn, generating a cliff-effect inflation profile that may be relatively independent of contemporaneous energy price developments;
- gas and electricity retail price caps. While such measures also have a direct effect on inflation, their impact on the inflation profile is normally smoother than for indirect tax measures.
- Indirect disposable income effects via aggregate demand. In this case, some cumulated upside effects on inflation could be expected. However, these effects will be relatively less pronounced and more lagged, as they operate via the disposable income channel that affects private consumption only partially and with some delay. At the same time, these effects may have a more persistent impact.
While the two channels tend to run in opposite directions, in the short term the impact on HICP inflation stems mainly from direct price effects. Chart A, panel b) provides annual estimates of the budget costs for these two main transmission channels, as well as for measures that are mixed in nature – falling into both categories – and those that cannot be easily classified into either category. In addition, it highlights the important distinction between broad-based and targeted measures, which is also relevant both from a distributional angle and in terms of macroeconomic transmission. Overall, targeted support to low-income households and energy-intensive firms remains limited in the euro area, although with significant heterogeneity across countries.[5]
Finally, combined with a more detailed mapping of fiscal instruments, the quarterly profile of fiscal support over the projection horizon also plays an important role, given its macroeconomic implications (Chart B). While in 2022 the size of the measures grew from quarter to quarter, the opposite can be observed thereafter. The quarterly profile points to a significant rolling back of certain measures already in the first quarter of 2023 (by about €30 billion). The cost of the measures is then estimated to roughly halve at the beginning of 2024, and to drop more gradually thereafter. Chart B also shows the fiscal instruments and propagation channels that are relevant for macroeconomic model simulations.
Chart B
Quarterly profile and macroeconomic channel classification of euro area discretionary fiscal policy support measures in response to the energy crisis and high inflation
(EUR billions)

Sources: ECB staff calculations based on the March 2023 ECB staff macroeconomic projections and updates to the fiscal questionnaires provided by the ESCB’s WGPF.
Notes: The classification of energy support measures is based on the WGPF definition of price measures (i.e. affecting the marginal cost of energy consumption), while income measures are classified based on the definition given in the article entitled “Fiscal policy and high inflation” in this issue of the Economic Bulletin. This classification is further adjusted to better account for the channels through which the measures affect inflation (beyond their recording in the government financial statistics, shown in Chart A, panel a). For the purpose of gauging the macroeconomic effects, other forms of support to firms (captured under profit/liquidity support) are simulated as being equivalent to lower direct taxation. For the quarterly profile, the estimates are based on a country-specific and bottom-up approach that accounts for the start and end date of application of individual measures and the announced quarter in which payment of income measures takes place, if known. Where the timeline of measures is not specified, the budget costs are equally distributed across quarters.
The estimates presented in this box are surrounded by a high level of uncertainty. Overall, the balance of risks with respect to the fiscal costs of these support measures, particularly in 2023, is assessed to be tilted towards less stimulus on account of the recent decline in energy prices. At the same time, some upward risks remain related to possible further energy support, particularly during winter 2023/24.
This box updates the estimates provided in the article entitled “Fiscal policy and high inflation”, which is included in this issue of the Economic Bulletin but was pre-released on 13 February 2023. It refers to government measures with an impact on the budget balance. In addition, some governments have enacted regulatory measures limiting the increase in energy prices that may not have a direct budget balance impact and/or other forms of liquidity support, such as guarantees. The latter would, in principle, affect their budget balances only if the guarantees (contingent liabilities) are activated.
The fiscal policy assumptions and projections in the context of the March 2023 ECB staff macroeconomic projections were finalised in early March 2023.
For an updated quantification of the impact of these measures on inflation over the period 2023-25, see the ECB staff macroeconomic projections published on 16 March 2023.
Moving from gross to net support (i.e. gross support minus discretionary financing measures), the euro area energy measures for 2023 remain broadly unchanged since the December 2022 projections, at 1.6% of GDP. For some discretionary financing measures, such as exceptional taxes on energy companies’ profits and lower subsidies to green energy-producing companies, the yield of the measures depends more directly on the dynamics of gas prices and has therefore been revised downwards more substantially, in particular in France.
Estimates range between 10% and 30% depending on the definition of “targeted”. Based on the means-tested definition used in the Eurosystem’s estimates, targeted measures amount to only 12% in 2023.