


Policy options for addressing window dressing in the G-SIB framework
This article summarises the existing evidence of window dressing and seasonality of data at year-end reporting time for global systemically important banks (G-SIBs). Window dressing and seasonality of data distort the outcome of a point-in-time reporting framework, resulting in misleading bank disclosures, mismeasurement of bank risk, inappropriate capital requirements and misallocation of capital. Reduced activity at certain points in time can also be detrimental to market functioning and has the potential to amplify shocks that coincide with period-ends. These negative consequences are amplified by the global nature of the activities and the systemic risk of the banks concerned. Possible policy options for addressing this phenomenon include different reporting requirements, such as averaging over higher frequency data, to ensure that the measurement of a bank’s contribution to systemic risk and capital allocation is commensurate with its actual risk to the financial system and the real economy throughout the year.
1 Why is window dressing in the G-SIB framework a problem?
Global systemically important banks (G-SIBs[1]) are the largest as well as the most complex, interconnected and internationally active banks in the world. A G-SIB’s systemic risk profile – notably the level and scope of its activities and interconnectedness with other large financial institutions across borders – is of such importance that a bank’s failure could threaten the stability of the entire global financial system. To mitigate the negative externalities which G-SIBs may represent for financial stability in the case of their failure, they are required to hold additional capital buffers associated with their risk level. The level of these capital buffers and the methodology used to define an institution as a G-SIB is laid down in the G-SIB framework of the Basel Committee on Banking Supervision (BCBS). The G-SIB assessment is carried out once a year and is based on banks’ annual data reporting. On 27th November 2023 the Financial Stability Board published the latest list of 29 G‑SIBs, following the assessment carried out by the BCBS.[2]
The G-SIB framework identifies the group of G-SIBs based on year-end balance sheet information. The identification of G‑SIBs follows an indicator-based approach, where the current methodology uses a set of fourteen risk indicators, grouped into five risk categories. These indicators are used to calculate a score for each bank’s systemic importance – the G-SIB score. The overall G-SIB score classifies G-SIBs into five pre-defined equally sized buckets, each corresponding to a different level of higher loss absorbency requirements.[3] The indicator-based methodology is relative, implying that balance sheet changes for one G-SIB affect not only its own score but also the scores of other banks in the sample. The calculation of these scores is carried out by the BCBS and is based on annual year-end data, which makes the methodology susceptible to window-dressing behaviour and seasonal demand fluctuations in general.
Window dressing refers to banks’ practice of reducing certain balance sheet items around anticipated reporting dates in order to appear safer. In principle, misrepresentative indicator values can result either from a seasonal decline in demand for banks’ market intermediation or from window dressing. These two causes can be difficult to distinguish in practice, particularly if data reporting occurs only once a year.[4] Window dressing can be performed actively by banks aiming to report more favourable regulatory metrics for several reasons such as improving financial ratios reported in financial statements, reducing tax liabilities and lowering capital or other regulatory requirements. Any misrepresentation of a bank’s risk level at year-end, or other specific reporting dates, is undesirable, whatever the underlying reason. Compressed indicator values affect banks’ G-SIB scores and can therefore cause allocation to risk buckets that are not commensurate with the actual risk level. Consequently, capital requirements may be inappropriate at the bank level, while at the system level capital may be misallocated across banks. The relativity principle of the G-SIB methodology implies, furthermore, that there are winners and losers from the mismeasurement of banks’ systemic footprint. In addition to financial stability risks, this may also lead to competitive distortion. Given these considerations the purpose of this article is to review the evidence of window dressing in the G-SIB framework and discuss possible policy options in the macroprudential space which could address the issue.
2 Evidence of window-dressing behaviour and year-end indicator seasonality in the G-SIB framework
There is solid evidence of window dressing and year-end seasonality in the indicators that underly the calculation of the score in the G-SIB framework. Several studies have tried to estimate G-SIB scores at a higher frequency from data that can be used to approximate the indicators of the G-SIB framework. These studies find that (i) the use of year-end data materially reduces G-SIB scores by between six and 20 basis points[5] and (ii) window dressing can lead to the misidentification of G-SIBs, bucket misallocation and, therefore, inappropriate capital requirements. Some studies have also found that the G-SIB framework itself can provide an incentive for window-dressing behaviour.[6] An explanation for this may lie in the relatively large size of the buckets and the sizeable step changes in the associated capital buffers. Specifically, a bank that attains G-SIB status has to meet a 1% higher loss absorbency requirement, which must be attained using Common Equity Tier 1 capital (i.e. relative to the stock of risk-weighted assets).[7] The capital requirements then change in 0.5 percentages point steps for buckets 2 to 4, and for bucket 5 the capital requirement increases by 1 percentage point. This introduces material discontinuities and can be a motivation to reduce the G-SIB score, the aim being either to avoid identification as a G-SIB or to be allocated to a bucket associated with a lower capital surcharge.
Chart 1
Volumes and interest rates of repos show strong declines at year-end for large European banking union (EBU) banks
a) Total outstanding repos | b) Repo rate |
|---|---|
(quarterly data December 2014-June 2023, EUR billions) | (weighted average repo rates, daily frequency, percentages) |
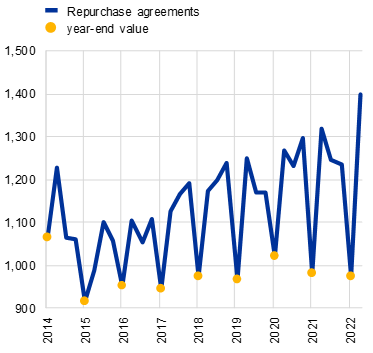 |  |
Source: ECB and ECB calculations.
Notes: Panel a: based on supervisory reporting from 22 banks. Panel b: see Bassi et al. (2023).
Repurchase agreements (repos) are a typical example of instruments for which window dressing is observed. Repos can have different maturities, although most transactions are carried out with a maturity of one business day (overnight) and very few transactions have maturities longer than one month. This opens up the possibility of substantially varying trading amounts for specific dates (such as anticipated reporting dates). Repos are components of several of the main indicators of the G-SIB framework, including the leverage ratio exposure measure, intra-financial system assets and liabilities as well as, when executed with non-domestic counterparties, cross-jurisdictional claims and liabilities. Variations in outstanding amounts of repos can therefore have a substantial impact on G-SIB indicators, the derived scores and, ultimately, the G-SIB buffer. Aggregate quarterly supervisory data for 22 banks in the banking union that report regularly to the G-SIB assessment exercise show a clear pattern of reduction towards year-end (Chart 1, panel a). Since 2015 the aggregate outstanding amount of repos has declined at year-end by up to 25% (Chart 2, panel b), or in absolute amounts by up to €325 billion.
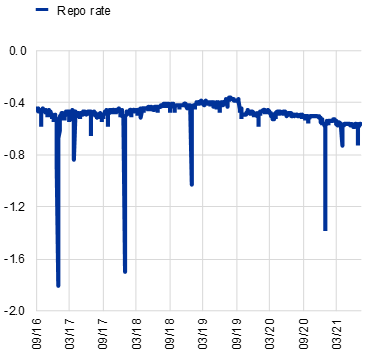
For the euro area, the variations in repos are also reflected in repo volumes and rates at a daily frequency. The reduced repo volumes have a significant impact on pricing with (average) repo rates declining by 1.5-2.0% at year-end and to a smaller but noticeable degree at quarter-end.[8] There is further evidence from high-frequency transaction-level data that variations in both the outstanding amounts of repos and in the associated repo rates are due to deliberate actions taken by banks ahead of regulatory reporting dates. In the days preceding year-end, repo volumes decline by 25% while at quarter-end reductions of 12.5% are seen. Specifically, at year-ends (quarter-ends) banks start to contract repo volumes 6-7 (2‑3) days before the reporting date and require more than 10 (7) days until pre-reporting date volumes are reached.[9] Such strong variations are not only relevant from a regulatory reporting perspective but can also be detrimental to market functioning.[10]
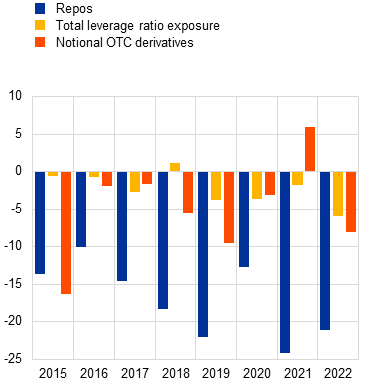
Chart 2
Sizeable reductions at year-end in total leverage exposure and notional OTC derivatives for large EBU banks
a) Total leverage ratio exposure and notional OTC derivatives | b) Year-end decline relative to previous quarter |
|---|---|
(quarterly data December 2014-June 2023, EUR trillions) | (percentage change between year-end and third quarter, percentages) |
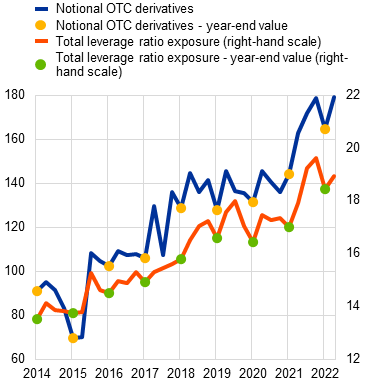 |  |
Sources: ECB and ECB calculations.
Notes: Panel a and b: based on supervisory reporting from 22 banks.
Sizeable variations towards year-end are also observed in the total leverage ratio exposure measure and in the amount of notional over the counter (OTC) derivatives. For the period from 2015 to 2022 the aggregate total leverage ratio exposure measure for 22 EBU banks that reported to the G-SIB assessment was a maximum of €1.1 trillion (or 5.9%) lower at any year-end relative to the preceding quarter. Likewise, over the same period the year-end reductions of notional OTC derivatives amounted to a maximum of €14 trillion (around 16%) of the outstanding amount of any preceding quarters (Chart 2 panels a and b). While repos are included in several indicators of the G-SIB framework and therefore their direct impact on the G-SIB score cannot be easily derived, the total leverage ratio exposure measure and notional OTC derivatives are single indicators receiving weights of 20% and 6.67% respectively in the calculation of the total score.
Window dressing leads to distorted G-SIB scores. The G-SIB score is calculated as a weighted average of the underlying indicator scores. For each indicator the bank-specific indicator score is calculated as the bank’s weight in the aggregate bank sample: the aggregate for each indicator is the so-called denominator. The relation of each bank to the aggregate via the denominator implements the relativity principle in the G-SIB framework.[11] Hence, a bank’s indicator scores and, as a result, its total score can also be affected by potential window-dressing behaviour from other banks in the sample, even if the bank in question does not alter its indicator amounts at year-end. In this sense window-dressing behaviour can produce both winners and losers. As a result, under the current framework, and in the knowledge that other banks are likely to window dress, each bank may be incentivised to window dress simply to prevent their G-SIB score from being mechanically increased. Furthermore, the bank sample that is relevant for the denominator calculation is determined by the 75 largest banks according to the total leverage ratio exposure measure.[12] Any window dressing of this measure could therefore impact on the composition of the bank sample that is relevant for the denominator calculation, providing a second indirect source of distorted G-SIB scores.
Historical estimated scores at a quarterly frequency suggest that there have been sizeable deviations from EBU banks’ official scores, with larger absolute deviations accounted for by G-SIBs. Since the data reporting to the G‑SIB assessment is only required at an annual frequency, an exact comparison between the official annual G-SIB scores at a higher frequency is not possible. However, quarterly scores can be approximated based on the regular quarterly supervisory data that EBU banks have to submit to the ECB. This strategy has been used in the literature and was repeated for the purpose of this article based on 18 EBU banks for which sufficient data were available.[13] Since quarterly indicator information was not available for the global bank sample, the intra-year denominators were based on the official year-end denominators, adjusted only for the indicator deviations derived from EBU banks’ quarterly indicators. Annual G-SIB scores based on these quarterly data were then derived as the average over the first three quarters of the year, and score deviations were calculated as the approximated G-SIB score minus the official score. The results corroborate the findings of earlier studies. On average, over time and across banks, the estimated G-SIB scores for EBU banks deviate from official scores by 4 basis points for all banks and 7 basis points for eight G-SIBs. However, upward score deviations based on intra-year data can reach substantially larger values (up to 38 basis points) and the maximum over time is, on average, 27 basis points. These figures are largely driven by the G-SIBs – maximum upward deviations for non-GIBs are, on average, around 7 basis points (Chart 3, panel a). By definition, G-SIBs have higher scores than non-G-SIBs and therefore also larger absolute deviations can be observed for G-SIBs. However, calculating score deviations from the total scores in percentage terms reveals that both groups of banks seem to engage in window dressing of a similar magnitude relative to their respective sizes. The percentage score deviations can be as much as 10% of the official year-end G-SIB scores (Chart 3, panel b).
Chart 3
G-SIB scores estimated from quarterly data can deviate substantially from the official annual G-SIB scores for large EBU banks
a) Distribution of absolute estimated G-SIB score deviations from official scores | b) Distribution of relative estimated G-SIB score deviations from official scores |
|---|---|
(deviation of estimated scores from official scores, basis points) | (deviation of estimated scores from official scores, percentages) |
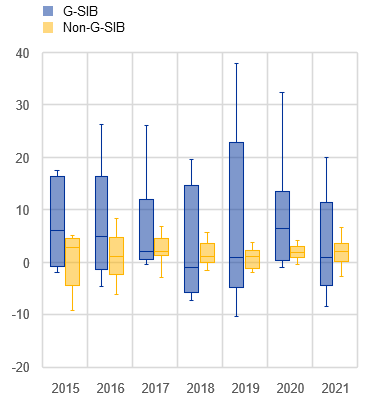 | 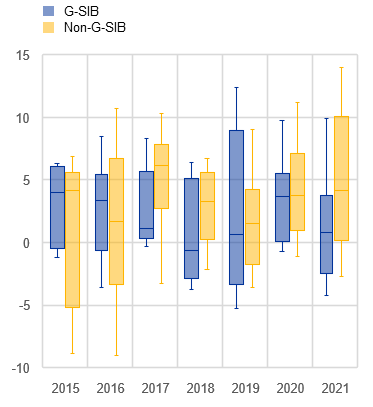 |
Sources: ECB and ECB calculations.
Notes: Panel a: the box plots show the distribution of absolute deviations of estimated annual scores based on quarterly data from official G-SIB scores. Panel b: the box plots show the distribution of percentage deviations of estimated annual scores based on quarterly data from official G-SIB scores.
Distorted scores can lead to bucket misallocation and therefore capital requirements that are not commensurate with the systemic importance of banks. Although the estimated score deviations are, on average, limited, the analysis has shown that larger deviations can occur for single institutions. Historically, these score deviations would have led to bucket reallocations in some cases (not shown) and thus to different capital requirements for some EBU banks. From a policy perspective it is extremely important to consider the robust finding that score deviations can lead to bucket – and hence capital – misallocation. Via the relativity principle in the G-SIB framework this can work in both directions, meaning that capital requirements could be lower or higher than warranted.
3 Possible policy options
The analysis shows that the main policy failure to be addressed is the specific point-in-time reporting at year-end. The alternative to year-end reporting is to require banks to report the relevant data as averages over a higher frequency which is more representative of the underlying risk level over the business year. This is particularly relevant for instruments that are usually traded at a high frequency with short maturities and whose volume can be “engineered down” at relatively low cost prior to reporting dates so that they appear safer at the reporting date.
Concrete policy options comprise requirements to report data averages across quarter-end, month‑end or through daily observations. The advantage of using averages over a time period is that they do not rely on one specific point in time that may be subject to idiosyncrasies related to market developments or obvious window-dressing activities. For example, the evidence in Section 2 shows that repos can vary substantially, even on a daily basis, and the same may be expected for OTC derivatives that are also traded at a high frequency. For such instruments even the use of averages across daily data might be conceivable. In general, a requirement to report averages across quarter-end or month-end data would immediately improve the current situation of distorted year-end reporting. For EBU banks, quarter-end averages are already available since the European reporting standards require quarterly reporting for the thirteen main indicators of the G-SIB framework.[14] In this respect, the G-SIB reporting template of the end-2022 assessment exercise required banks to report the ten indicators deemed to be most vulnerable to window-dressing activities as quarter-end averages.[15] This was on a mandatory basis, with the reporting of month-end averages on an optional basis. However, the averages of point-in-time measures over quarter-ends and month-ends could still suffer from potential mismeasurement or misreporting at these points in time. To the extent that the largest indicator reductions might occur at year-ends, such reductions would also still be reflected with a weight of one-fourth in the quarter-end averages but with a weight of only one-twelfth if averages were computed based on month-end data.
Averages across daily data would remove risk measurement distortions most comprehensively. The Board of the Federal Reserve System has recently put forward such a policy proposal as part of its consultation procedure on a holistic review of capital standards for large US banks.[16] The proposal is to require the reporting of daily average data over the reporting quarter for nine G-SIB indicators in the US method 2 framework. In addition, certain off-balance-sheet items would need to be reported as the average of month-end values over the reporting quarter rather than an average of daily values. These more stringent reporting requirements would be limited to US G-SIBs.
The benefits of stricter reporting requirements are likely to outweigh the costs. In principle, the benefits consist of capital requirements that are more commensurate with the risk level of a global bank from a loss-given-default perspective. Given the size and complexity of the banks that are assessed in the G-SIB framework, and especially those officially categorised as systemically important for the global financial system, these benefits are substantial for the financial system and the real economy. In addition, enhanced measurement of risk at the bank level would also improve the workings of the relativity principle in the G‑SIB framework. It would mitigate the problem that some banks may face negative externalities arising from the window-dressing behaviour of others (e.g. they could receive a higher total score because the window-dressing behaviour of others could suppress global denominators). Beyond that, it is reasonable to expect that market functioning could be improved and, ultimately, efficiency and profitability gains at the system level would also be likely. These benefits to the stability of the financial system, the real economy during stress in the financial system as well as market functioning should be weighed against the additional costs. Additional costs can arise for a bank from tracking data at a higher frequency, quality assuring data and, potentially, reporting data more frequently. In addition, the supervisor will face higher costs associated with monitoring and assessing the more complex data submissions. Cost considerations should also cover the proportionality aspects of additional reporting requirements. However, cost increases can be mitigated by drawing on existing data collections such as trade repositories and credit registers.
One policy option could be to require averages of high-frequency data for those indicators that are most prone to window dressing and seasonality. While the benefits of more appropriate risk measurement and risk-commensurate capital requirements are substantial at the system level, associated higher reporting costs can vary across indicators and banks. A first cost-mitigating aspect of using averages for higher-frequency data (e.g. daily) is that reporting would be required less frequently (e.g. monthly or quarterly). Furthermore, the policy options could in principle be differentiated in respect of indicator range and bank category. With regard to the range of indicators, average reporting is most useful for those indicators that are most prone to seasonality and window-dressing activities. This aspect was also reflected in the abovementioned additional reporting of the end-2022 G-SIB assessment template. In general, that reporting requirement focused on stock variables, leaving out flow variables such as, for example, underwriting activities and certain trading indicators. With regard to the differentiation in respect of bank categories, consideration could, for example, be given to requiring larger banks, in particular G-SIBs, to provide more detailed information, as suggested in the aforementioned US consultation proposal. However, the categorisation (e.g. into G-SIBs and non-G-SIBs) has several drawbacks and should be avoided. Reporting standards can change annually and might only be implementable with a delay after G-SIB status has been established. Distinguishing by bank category would also introduce additional heterogeneity into the G-SIB framework and would make it more complex, with potential implications for monitoring costs and more complicated requirements in respect of communicating the results. Furthermore, and perhaps most importantly, new cliff effects could arise increasing window-dressing incentives for those banks that are close to, but below, the G-SIB designation threshold.
Supervisory judgement provides an option for overruling the outcome of the scoring methodology in rare cases and could in principle also be applied in the context of window dressing. The G-SIB framework provides for the possibility of applying supervisory judgement in cases where the standard scoring methodology is deemed to be inappropriate for the identification of a bank as a G-SIB and its associated capital requirement. However, according to the provisions laid down in the G-SIB framework, supervisory judgement is expected to be used only rarely and should be based on quantifiable information. While this approach could address a problem with a single institution in a specific assessment year it would fail to address the window-dressing problem on a broader scale. Specifically, the reclassification of a bank to a different bucket (higher or lower) or as a G-SIB instead of a non-G-SIB (or vice versa) would not correct the underlying metrics that are essential for the calculation of scores for all banks in the sample. Notably, a reclassification based on supervisory judgement would not affect the global indicator denominators. As a result, any distortions arising from indicator misreporting would still have a negative impact on the relativity principle of the G-SIB framework and hence on all other banks that are not considered for supervisory judgement.
4 Conclusion
There is robust evidence that the G-SIB framework is sensitive to misrepresentation of systemic importance resulting in capital misallocation due to the window dressing or seasonality of data. This problem follows directly from the current requirement to report annual data only at year-end. Measurement that does not properly represent the risk level of an institution translates into distorted G-SIB scores, leading to capital misallocation and insufficient bank resilience, with negative implications for the stability of the global financial system and the real economy during periods of financial stress. The most efficient policy option for addressing the problem involves requiring data to be reported as averages over high-frequency points in time during the year. Which frequency is most appropriate for the underlying data depends on the extent to which an indicator is vulnerable to window dressing. In general, the benefits of increased reporting requirements are likely to outweigh higher reporting and monitoring costs, as the policy options target the most systemically important global banks. For such banks failure or lending impairment would create enormous stress in the financial system and harm the real economy.
References
Allen, L. and Saunders, A. (1992), “Bank Window Dressing: Theory and evidence”, Journal of Banking and Finance, Vol. 16, Issue 3, pp. 585-623, North Holland.
Bassi, C., Behn, M., Grill, M. and Waibel, M. (2023), “Window dressing of regulatory metrics: evidence from repo markets”, Working Paper Series, No 2771, ECB, Frankfurt am Main, February.
Basel Committee on Banking Supervision (2021), “Basel Framework, SCO40 – Global systemically important banks”, Bank for International Settlements.
Behn, M., Mangiante, G., Parisi, L. and Wedow, M. (2018), “Does the G-SIB framework incentivise window-dressing behaviour? Evidence of G-SIBs and reporting banks”, Macroprudential Bulletin, No 18, ECB, Frankfurt am Main, October.
Behn, M., Mangiante, G., Parisi, L. and Wedow, M. (2022), “Behind the scenes of the beauty contest: window dressing and the G-SIB framework”, International Journal of Central Banking, Vol. 18, No 5, pp. 1-42, December.
Board of Governors of the Federal Reserve System (2023), “Agencies request comment on proposed rules to strengthen capital requirements for large banks”, Joint press release: Board of Governors of the Federal Reserve System, Federal Deposit Insurance Corporation and Office of the Comptroller of the Currency, 27 July.
Financial Stability Board (2023), “FSB publishes 2023 G-SIB list”, Press Release, 27 November 2023.
Garcia, L., Lewrick, U. and Sečnik, T. (2021), “Is window dressing by banks systemically important?”, BIS Working Papers, No 960, Bank for International Settlements, Basel, August.
Jaafar, A., Polizzi, S. and Reghezza, A. (2023), “Persistency of window dressing practices in the U.S. repo markets after the GFC: The unexplored role of the deposit insurance premium”, European Financial Management, Vol. 29, Issue 2, pp. 634-663, March.
Munyan, B. (2015), “Regulatory arbitrage in repo markets”, Office of Financial Research Working Paper 15-22, 29 October.
European Union Banking Regulation transposes the BCBS recommendation into EU law using the term “global systemically important institutions”, while the BCBS uses the term “global systemically important banks”. For simplicity, this article uses the BCBS term.
See Financial Stability Board (2023).
A bank is classified as a G-SIB when its score is at least 130 basis points. The buckets corresponding to the different higher loss absorbency requirements each have a range of 100 basis points, meaning that the next bucket thresholds are at 230, 330, 430 and 530 basis points. Supervisory judgement may also be used to add banks to the list of G-SIBs if their scores are below 130 basis point or to reallocate a bank to a bucket that is different from that implied by the scoring methodology. For further details see Basel Committee on Banking Supervision (2021).
Allen and Saunders (1992) provide an early account of banks’ window-dressing behaviour for quarterly reporting. They distinguish active (or endogenous) and passive (or exogenous) window dressing, where the latter “results from forces external to the bank, such as corporate incentives to reduce quarter-end borrowing in order to window dress their balance sheets”.
See, for example, Garcia et al. (2021)Behn et al. (2018)Behn et al. (2022), and .
See Behn et al. (2022).
In addition, G-SIBs are subject to a Tier 1 capital add-on to their leverage ratio requirement amounting to 50% of the percentage point G-SIB buffer rate, a minimum requirement for total loss-absorbing capacity, group-wide resolution planning and regular resolvability assessments, as well as to meet higher supervisory expectations for risk management functions, risk data aggregation capabilities, risk governance and internal controls.
See Bassi et al. (2023).
See Bassi et al. (2023).
Window dressing may be observed, albeit to a different extent, in most jurisdictions that report to the BCBS G-SIB assessment. Across countries the motivations behind window dressing do not always appear to be closely linked. For example, Munyan (2015)Jaafar et al (2023) finds that window dressing in repo markets is particularly notable for European and Japanese banks, which only report quarter-end figures (i.e. the figures on the last day of each fiscal quarter). By contrast, US banks show less frequent window-dressing behaviour, probably because they are required to report both quarter-end and daily averages over the quarter. find evidence of window-dressing behaviour in repos among US bank holding companies, especially in the case of US G-SIBs. This is likely driven by an incentive to lower the Federal Deposit Insurance Corporation’s deposit insurance premium, which is computed based on outstanding amounts at quarter-end.
Specifically, scores for each indicator are calculated as the indicator value for each bank divided by the sum of the indicator values across all banks in the sample, the denominator, multiplied by 10,000. The total G-SIB score is then calculated as a weighted average across the fourteen indicators based on pre-defined indicator weights according to the G-SIB methodology.
Each year banks with a leverage ratio exposure measure exceeding €200 billion are required to report their data in the G-SIB assessment. The main sample is the sample of banks which consists of the 75 largest banks ranked by their leverage ratio exposure measure (the only indicator in the size category) plus banks that had been designated as G-SIBs in the previous year. In the 2023 G-SIB assessment based on end-2022 data this sample consisted of 77 banks because although two banks were ranked below 75 according to their leverage ratio exposure measure they had been identified as G-SIBs in 2022 based on end-2021 data.
The indicator approximation follows Garcia et al. (2021). Given that the specific reporting requirements in a G-SIB framework are only required on an annual basis, regular quarterly supervisory data were used to approximate the G-SIB indicators. Since this resulted in level differences in some cases, partly because the G-SIB templates contain certain netting possibilities, the approximated quarterly indicators were rebased to the official G-SIB indicators at each year-end. Hence the approximation relies on the assumption that the intra-year dynamics of the ECB supervisory data are a good representation of the G-SIB indicators. As a result, the approximated quarterly G-SIB scores are identical to the official G-SIB scores in the fourth quarter, although they deviate from these over the first three quarters of every year.
Two trading volume indicators from the G-SIB framework are reported as an aggregate.
These are: total leverage exposures, intra-financial system assets, intra-financial system liabilities, securities outstanding, assets under custody, notional OTC derivatives, trading and available-for-sale securities, level 3 assets, cross- jurisdictional claims and jurisdictional liabilities.
See Board of Governors of the Federal Reserve System (2023). The indicators under consideration are intra-financial system assets, intra-financial system liabilities, securities outstanding, assets under custody, OTC derivatives, trading and available-for-sale securities, level 3 assets, cross-jurisdictional claims and cross-jurisdictional liabilities. For total leverage exposures the reporting of daily averages is already required, with the exception of off-balance-sheet items for which month-end averages should be reported.