


Long-term trends in loan-to-value (LTV), debt-to-income (DTI) and debt-service-to-income (DSTI) ratios started to reverse in 2022.[1] In recent years, LTVs and DTIs had been on an upward trend due to substantial increases in residential real estate (RRE) prices, whereas DSTIs had remained relatively stable in an environment of low interest rates accompanied by lengthening maturities.[2] These trends started to reverse in 2022 as the share of lending with high LTVs and DTIs declined[3] and the share of lending with high DSTIs increased (Chart A, panel a). In addition, recent dynamics in lending standards in the countries with borrower-based measures (BBMs) in place were broadly similar to those in the countries without these measures (Chart A, panel a). Nevertheless, there is a notable difference between the share of more risky lending in countries with BBMs in place and the share of such lending in those countries that do not have them. The share of lending with LTVs above 90%, DTIs above 7 and DSTIs above 40% tends to be higher in countries where no limits are in place (although the share of lending with DSTIs between 30% and 40% is higher in countries with DSTI caps).[4]
Higher interest rates in combination with elevated RRE prices are pushing up servicing costs for mortgages, resulting in higher shares of new loans with DSTIs over 30%. This increase was particularly evident in the second half of 2022, coinciding with the start of rapidly rising interest rates. The share of lending with DSTIs above 30% increased on average across countries in this period (Chart A, panel a). Upward pressure on DSTIs could continue in 2023 in view of potential further increases in bank lending rates in response to monetary policy tightening. This upward pressure could be counteracted to some extent by a decline in house prices, which would lower the loan amounts needed to purchase a property, or by a lengthening of loan maturities. While the long-term trend of lengthening loan maturities seems to have continued during 2022 in some countries, there was no consistent increase in maturities across all countries. Nevertheless, there was an increase in average loan maturities in certain countries, combined with a rising share of lending with high DSTIs.
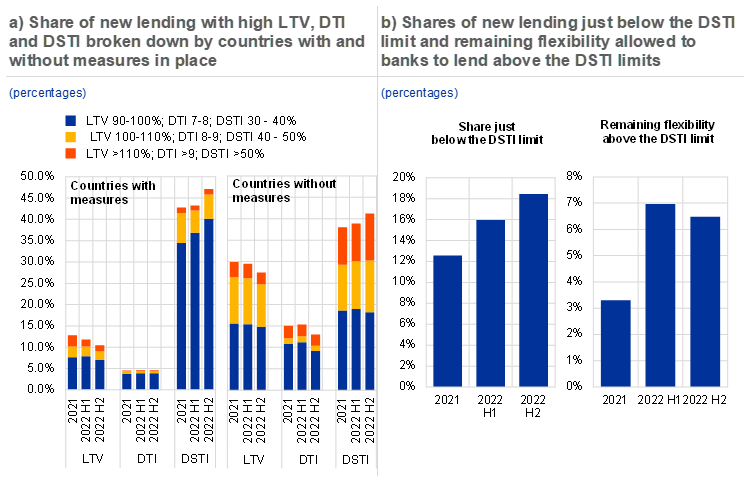
In countries with regulatory caps on monthly mortgage repayment ratios, an increasing share of new loans have DSTIs close to the limits. Shares of new lending in the buckets just below the country-specific DSTI limits increased substantially in 2022: from 13% in 2021 to 16% in the first half of 2022, and to 18% in the second half of 2022 (Chart A, panel b). This increase is in line with expectations, as loan servicing costs increase in step with higher interest rates. While a higher share of lending just below the regulatory limit does not automatically imply that the measures are more binding, it raises the question of whether DSTI limits might start constraining access to the mortgage market as interest rates are increasing. It is therefore worth monitoring how much use banks make of the flexibility allowed to them to lend above the regulatory limits, as this can offer important insights into the extent to which the DSTI limits are binding.
Banks are not making full use of the flexibility allowed to them to lend above the DSTI limits, suggesting the measures in place are not excessively constraining lending. In several countries the design of BBMs restricting DSTIs includes exemptions permitting banks to lend above the regulatory limits for a certain fraction of new lending in a given period. Had these exemptions been used fully in 2022, or substantially more than in 2021, it would have suggested that the DSTI limits in place were possibly constraining new lending. However, the flexibility allowed to banks to lend above the regulatory limits was used less in 2022 than in 2021, although slightly more in the second half than in the first half of the year (Chart A, panel b). This implies that banks would still have been able to lend more to borrowers with high DSTIs. It is therefore unlikely that the decline in new mortgage lending observed in most euro area countries is attributable to existing DSTI caps being more binding.
Chart A
Loan-to-value and debt-to-income ratios are decreasing, while debt-service-to-income ratios have been increasing since interest rate hikes started in 2022, contributing to an increasing share of loans just below regulatory DSTI caps
Sources: Data collection from national authorities and ECB calculations.
Notes: Panel a): The DTI and DSTI categories also include data for countries reporting loan-to-income (LTI) and loan service-to-income (LSTI). L(S)TI is shown when D(S)TI is missing. Data on lending shares across countries are weighted by GDP to derive the aggregate figures. Sample of countries with DSTI/LSTI limits in place: Estonia, France, Cyprus, Malta, Austria, Portugal, Slovenia, Slovakia, Finland. Sample of countries without DSTI/LSTI limits in place: Belgium, Ireland, Greece, Croatia. Sample of countries with DTI/ LTI limits in place: Ireland, Slovakia. Sample of countries without DTI/LTI limits in place: Belgium, Estonia, France, Greece, Croatia, Cyprus, Malta, Austria, Portugal, Slovenia, Finland. Sample of countries with LTV limits in place: Belgium, Estonia, Ireland, Cyprus, Latvia, Malta, Austria, Portugal, Slovenia, Slovakia, Finland. Sample of countries without LTV limits in place: Greece, Spain, France, Croatia. Panel b): The charts are based on countries with LSTI/DSTI limits in place, namely: Austria at 40% (+10% flexibility); Estonia 50% (+15%); France 35% (+20%); Portugal at 50% with stressed interest rates (+15%); Slovenia at 50% (+10%); Slovakia at 60% (+5%); Malta at 40% with stressed interest rates (+0%); and Finland at 60% with stressed interest rates (+15%). The left chart in panel b) shows shares of new lending in a bucket just below the limit (with the exception of Slovakia and Finland, where a 40-50% bucket is used in the absence of one just below 60%). For Malta, Portugal and Finland, unshocked DSTIs are reported in the survey, while the limit is binding for the shocked DSTIs. The right chart in panel b) shows the countries where the design of the LSTI/DSTI limits includes exemptions. Euro area bars weighted by GDP in 2022.
Data analysed in this box were reported by national authorities as part of the ECB/ESRB survey on national lending standards for the second half of 2022. Most data reported in the survey are compliant with the ESRB recommendation on closing data gaps, but some differences in definitions remain, which might hamper cross-country comparisons. We report DSTI and DTI where available, and loan service-to-income (LSTI) and loan-to-income (LTI) where DSTI and DTI are not available. For readability we use the abbreviations DSTI and DTI in the text, instead of DSTI/LSTI and DTI/LTI.
See Lang et al. (2020) and ECB (2021).
While decreases in the shares of high LTVs were observed in almost all euro area countries that provided the data, trends in DTIs were more varied.
The significantly higher share of lending in the 30-40% bucket for countries having a DSTI limit in place is driven to some extent by the share of lending reported in that bucket by France, which has a DSTI limit of 35%.