
1 Overview of results
In the January 2024 bank lending survey (BLS), euro area banks moderately tightened their credit standards further for loans or credit lines to enterprises in the fourth quarter of 2023 (net percentage of banks of 4%; see Overview table).[1] The tightening adds to the substantial cumulative tightening since 2022, which has contributed, together with weak demand, to the strong fall in loan growth to firms. Banks’ risk perceptions related to the economic outlook and the situation of firms continued to have a tightening impact, whereas the impact of banks’ cost of funds and balance sheet situations, competition and risk tolerance was broadly neutral at the euro area level in the fourth quarter of 2023. While banks in three out of the four largest euro area countries saw unchanged credit standards, banks in most of these countries reported a perception of greater risks. The impact of past tightening will continue to dampen loan growth in the coming quarters, in line with the leading indicator properties of credit standards (about 5-6 quarters ahead of actual loan growth developments), such that actual lending to firms can be expected to remain weak in 2024. The net percentage of banks reporting a tightening moderated compared with the previous quarter (12% in the third quarter of 2023), was lower than banks had expected (7%) and lower than the historical average (9%). At the same time, banks expect further net tightening for the first quarter of 2024 (9%).
Banks reported a further net tightening of credit standards for loans to households in the fourth quarter of 2023, which was small for housing loans and more pronounced for consumer credit (net percentages of 2% and 11% respectively; see Overview table). Risk perceptions were a major driver of the tightening of credit standards in both categories, with banks’ lower risk tolerance also driving the tightening of credit standards for consumer credit. While the slight tightening in the housing loan segment was driven by smaller euro area countries, credit standards in consumer credit tightened across the four largest euro area economies. For both loan categories, the net tightening was lower compared with the third quarter (11% for housing loans and 16% for consumer credit) but was broadly in line with what had been expected. Banks expect a further net tightening of credit standards in both loan categories.
Firms’ net demand for loans continued to decrease markedly in the fourth quarter of 2023 (net percentage of -20%; see Overview table). The decline in loan demand was mainly driven by higher interest rates, reported by banks in all four of the largest euro area economies, and lower fixed investment, consistent with the net decrease in demand for long-term loans. By contrast, financing needs for inventories and working capital contributed slightly positively to loan demand. While the net percentage of banks reporting a decrease was considerably smaller than its all-time low in the second quarter of 2023 (-42%), the renewed decline added to the substantial net decreases in loan demand over the previous four quarters. The decline in net demand was in line with banks’ expectations. In the first quarter of 2024, banks expect a small net increase in demand for loans to firms for the first time since the second quarter of 2022.
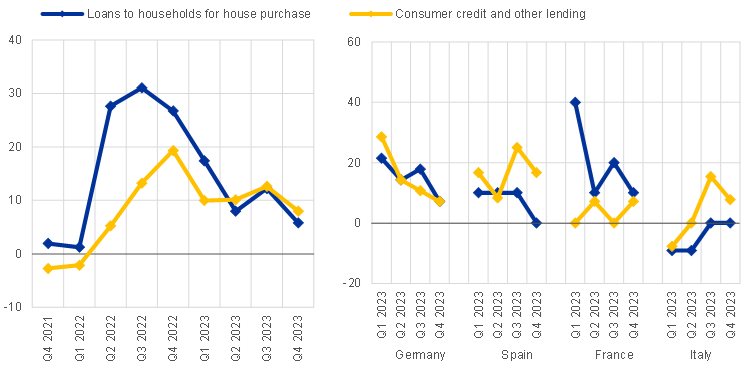
Net demand for housing loans and consumer credit continued to decrease (net percentages of -26% and -7% respectively; see Overview table). For both housing loans and consumer credit, the general level of interest rates and consumer confidence were major drivers of the decline in demand, with housing market prospects also exerting substantial downward pressure on housing loan demand. Net declines were observed across the four largest euro area economies. For both loan categories, the net decrease was more moderate than in the previous quarter (‑45% for housing loans and -12% for consumer credit) but, for housing loans, more substantial than expected. In the first quarter of 2024, banks expect an increase in housing loan demand for the first time since the first quarter of 2022, but a continued decrease in consumer credit demand.
Banks’ overall credit terms and conditions tightened moderately further for firms and consumer credit but eased for housing loans. The net easing in the housing loan category was not accompanied by a corresponding decrease in lending margins and followed seven quarters of tightening (since the first quarter of 2022).
In the fourth quarter of 2023, banks reported a further net increase in the share of rejected applications across all loan segments.
The January 2024 BLS contained a number of ad hoc questions.
- Euro area banks’ access to funding improved somewhat for money markets, long-term deposits and debt securities, while banks’ access to short-term retail funding and securitisation tightened slightly in the fourth quarter of 2023. Over the next three months, access to funding across all segments except short-term deposits and securitisation is expected to improve.
- Banks indicated that supervisory or regulatory actions contributed to higher levels of capital as well as liquid and risk-weighted assets, and had a net tightening impact on banks’ credit standards and credit margins across most loan categories in 2023. A further tightening impact is expected in 2024.
- Perceived credit risks in banks’ loan portfolios had a moderate tightening impact on their credit standards for loans to enterprises and consumer credit in the second half of 2023, while the impact was neutral for housing loans. Banks expect similar impacts in the first half of 2024.
- Lending conditions for firms tightened moderately further in most economic sectors in the second half of 2023, ranging from almost no net tightening in services to relatively large net tightening in the commercial real estate, construction and residential real estate sectors. Demand for loans decreased in net terms in all economic sectors, especially in real estate and construction. In the first half of 2024, banks expect further net tightening in lending conditions, albeit lower in all sectors except for construction and services. They also expect a moderate further net decrease in loan demand in several economic sectors, mostly concentrated in real estate and construction.
- Banks reported that the decline in excess liquidity in the Eurosystem in the second half of 2023 had only a limited impact on bank lending conditions. Similar effects are expected in the first half of 2024.
Overview table
Latest BLS results for the largest euro area countries
(net percentages of banks reporting a tightening of credit standards or an increase in loan demand)
Country | Enterprises | House purchase | Consumer credit | |||||||||||||||
|---|---|---|---|---|---|---|---|---|---|---|---|---|---|---|---|---|---|---|
Credit standards | Demand | Credit standards | Demand | Credit standards | Demand | |||||||||||||
Q3 23 | Q4 23 | Avg | Q3 23 | Q4 23 | Avg | Q3 23 | Q4 23 | Avg | Q3 23 | Q4 23 | Avg | Q3 23 | Q4 23 | Avg | Q3 23 | Q4 23 | Avg | |
Euro area | 12 | 4 | 9 | -36 | -20 | -1 | 11 | 2 | 7 | -45 | -26 | 0 | 16 | 11 | 5 | -12 | -7 | 0 |
Germany | 10 | 6 | 4 | -23 | -16 | 5 | 4 | 0 | 4 | -32 | -7 | 5 | 7 | 4 | 1 | -4 | -4 | 6 |
Spain | 8 | 0 | 9 | -58 | -8 | -6 | 30 | 0 | 14 | -60 | -20 | -10 | 42 | 25 | 10 | -33 | -8 | -8 |
France | 17 | 0 | 7 | -25 | -17 | -4 | 10 | 0 | 4 | -60 | -60 | 2 | 21 | 14 | -1 | -29 | -14 | -2 |
Italy | 18 | 0 | 12 | -73 | -18 | 4 | 0 | 0 | 1 | -45 | -36 | 9 | 8 | 23 | 4 | -23 | -15 | 10 |
Notes: “Avg” refers to historical averages, which are calculated over the period since the beginning of the survey, excluding the most recent round. Owing to the different sample sizes across countries, which broadly reflect the differences in the national shares in lending to the euro area non-financial private sector, the size and volatility of the net percentages cannot be directly compared across countries.
Box 1
General notes
The BLS is addressed to senior loan officers at a representative sample of euro area banks, representing all euro area countries and reflecting the characteristics of their respective national banking structures. The main purpose of the BLS is to enhance the Eurosystem’s knowledge of bank lending conditions in the euro area.[2]
Detailed tables and charts based on the responses provided can be found in Annex 1 for the standard questions and Annex 2 for the ad hoc questions. In addition, BLS time series data are available on the ECB’s website via the ECB Data Portal.
Detailed explanations on the BLS questionnaire, the aggregation of banks’ replies to national and euro area BLS results, the BLS indicators and information on the BLS series keys are available on the ECB’s website in the BLS user guide. A copy of the BLS questionnaire and a glossary of BLS terms can also be found on the ECB's website.
2 Loans to enterprises
2.1 Credit standards tightened moderately further
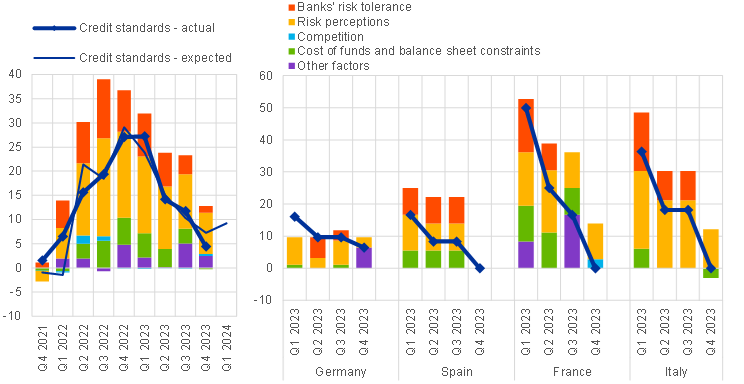
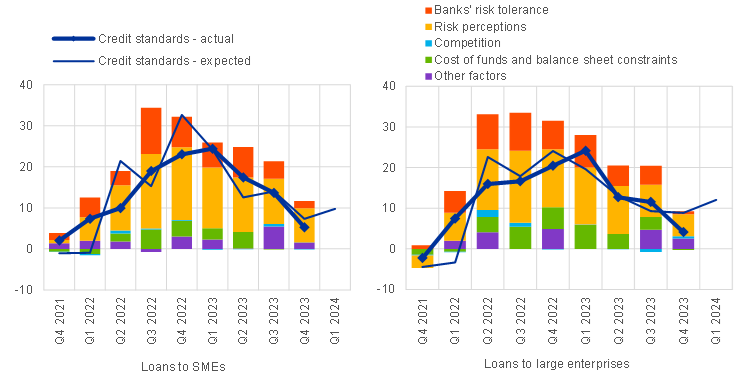
Euro area banks moderately tightened their credit standards further for loans or credit lines to enterprises in the fourth quarter of 2023 (net percentage of banks of 4%; see Chart 1 and Overview table).[3] The tightening adds to the substantial cumulative tightening since 2022, which has contributed, together with weak demand, to the strong fall in loan growth to firms. The impact of past tightening will continue to dampen loan growth in the coming quarters, in line with the leading indicator properties of credit standards (about 5-6 quarters ahead of actual loan growth developments), such that actual lending to firms can be expected to remain weak in 2024. The tightening in the fourth quarter was driven by banks in Germany and several smaller euro area countries, while banks in the other three largest euro area economies reported unchanged credit standards. The net percentage of banks reporting a tightening moderated compared with the previous quarter (12% in the third quarter of 2023) and was lower than banks had expected (7%). It was also below the historical average (9%) for the first time since the first quarter of 2022.[4] The net tightening of credit standards was similar for loans to small and medium-sized enterprises (SMEs) and for loans to large firms (net percentages of 5% and 4%, respectively; see Chart 2). It was stronger for long-term loans (7%) than for short-term loans (4%).
Banks’ risk perceptions continued to have a tightening impact, while the impact of banks’ cost of funds and balance sheet situation, competition and risk tolerance was broadly neutral at the euro area level in the fourth quarter of 2023 (see Chart 1 and Table 1). The weak economic situation and outlook, together with credit risk for firms related to their financial situation, were the main underlying reasons for the tightening impact of risk perceptions. Banks in most of the largest euro area economies reported a tightening impact owing to greater credit risks. Related to this, some banks mentioned the elevated level of interest rates as an additional tightening factor (included in “other factors”).[5] By contrast, while banks had reported a lower risk tolerance in previous quarters, contributing to tighter credit standards, banks did not further revise their risk tolerance in the fourth quarter. Banks’ own financial situation regarding their capital and liquidity position, as well as their market financing costs, did not contribute to further tightening, with banks in Italy even reporting a net easing impact of their access to market financing. According to the banks surveyed, competition had a neutral impact in net terms on credit standards in the fourth quarter of 2023.
Chart 1
Changes in credit standards applied to the approval of loans or credit lines to enterprises, and contributing factors
(net percentages of banks reporting a tightening of credit standards and contributing factors)
Notes: “Actual” values are changes that have occurred, while “expected” values are changes anticipated by banks. Net percentages are defined as the difference between the sum of the percentages of banks responding “tightened considerably” and “tightened somewhat” and the sum of the percentages of banks responding “eased somewhat” and “eased considerably”. The net percentages for responses to questions related to contributing factors are defined as the difference between the percentage of banks reporting that the given factor contributed to a tightening and the percentage reporting that it contributed to an easing. “Cost of funds and balance sheet constraints” is the unweighted average of “banks’ capital and the costs related to banks’ capital position”, “access to market financing” and “liquidity position”; “risk perceptions” is the unweighted average of “general economic situation and outlook”, “industry or firm-specific situation and outlook/borrower’s creditworthiness” and “risk related to the collateral demanded”; “competition” is the unweighted average of “competition from other banks”, “competition from non-banks” and “competition from market financing”. The net percentages for “other factors” refer to an average of the further factors which were mentioned by banks as having contributed to changes in credit standards.
Chart 2
Changes in credit standards applied to the approval of loans or credit lines to SMEs and large enterprises, and contributing factors
(net percentages of banks reporting a tightening of credit standards and contributing factors)
Note: See the notes to Chart 1.
In the first quarter of 2024, euro area banks expect further net tightening for loans to firms (net percentage of 9%). This would be in line with the historical average net tightening of credit standards for loans to firms since the start of the BLS in 2003 (see above).[6] Banks also expect an increase in the net tightening for loans to SMEs (net percentage of 10%) and for loans to large firms (net percentage of 12%).
Table 1
Factors contributing to changes in credit standards for loans or credit lines to enterprises
(net percentages of banks)
Country | Cost of funds and balance sheet constraints | Pressure from competition | Perception of risk | Banks’ risk tolerance | ||||
|---|---|---|---|---|---|---|---|---|
Q3 2023 | Q4 2023 | Q3 2023 | Q4 2023 | Q3 2023 | Q4 2023 | Q3 2023 | Q4 2023 | |
Euro area | 3 | 0 | 0 | 0 | 11 | 9 | 4 | 1 |
Germany | 1 | 0 | 0 | 0 | 8 | 3 | 3 | 0 |
Spain | 6 | 0 | 0 | 0 | 8 | 0 | 8 | 0 |
France | 8 | 0 | 0 | 3 | 11 | 11 | 0 | 0 |
Italy | 0 | -3 | 0 | 0 | 21 | 12 | 9 | 0 |
Note: See the notes to Chart 1.
2.2 Terms and conditions tightened moderately further
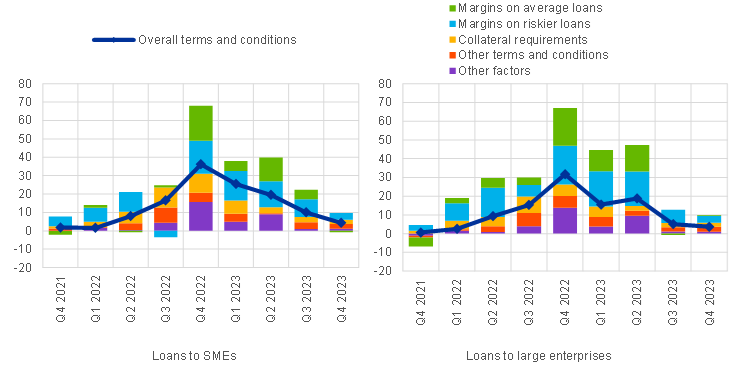
Banks’ overall terms and conditions for new loans to enterprises tightened moderately further (net percentage of 4%; see Chart 3 and Table 2).[7] The net tightening added to the tightening of past quarters, reflecting the pass-through of ECB policy rate hikes and the adjustment of bank lending policies to higher credit risks. For the first time since the fourth quarter of 2022, margins on average loans (defined as the spread over relevant market reference rates) have not widened further in net terms at the euro area level but remained broadly unchanged. This development was mainly driven by a narrowing of average loan margins by banks in Italy, mainly due to competition by other banks, whereas banks in the other three largest euro area economies reported a further widening of average loan margins. By contrast, margins on riskier loans to firms did widen further at the euro area level. Some banks also referred to the level of interest rates (within “other factors”) as a tightening factor. In addition to the pricing of new loans, banks also referred to a tightening impact of “other terms and conditions” via loan covenants, collateral requirements and loan size, showing that banks demand additional protection against potential credit losses in the context of higher borrowing costs and weak economic growth. Overall, the net tightening was smaller in the fourth quarter of 2023, reflecting the unchanged policy rates in the fourth quarter, while the pass-through of policy to lending rates via the bank lending channel continued.
Banks reported a moderate further net tightening of overall terms and conditions for loans to both SMEs and large firms (net percentage for both at 4%; see Chart 4). For both, the net tightening was driven by a widening of margins on riskier loans, slightly tighter collateral requirements and some other terms and conditions, especially tighter loan covenants. Instead, margins on average loans had a broadly neutral impact on overall terms and conditions for both loans to SMEs and large firms.
Chart 3
Changes in terms and conditions on loans or credit lines to enterprises
(net percentages of banks reporting a tightening of terms and conditions)

Notes: “Margins” are defined as the spread over relevant market reference rates. “Other terms and conditions” is the unweighted average of “non-interest rate charges”, “size of the loan or credit line”, “loan covenants” and “maturity”. The net percentages for “other factors” refer to an average of the further factors which were mentioned by banks as having contributed to changes in terms and conditions.
Banks’ higher risk perceptions and lower risk tolerance continued to be the main drivers of the net tightening in overall terms and conditions for loans to firms, while competition had an easing impact (see Table 3). Risk perceptions, related to the economic outlook and the situation of firms, continued to have the largest tightening impact on terms and conditions. The net easing impact of competition was mainly related to competition with other banks, especially in Italy (net percentage of -36%).
Table 2
Changes in terms and conditions on loans or credit lines to enterprises
(net percentages of banks)
Country | Overall terms and conditions | Banks’ margins on average loans | Banks’ margins on riskier loans | ||||
|---|---|---|---|---|---|---|---|
Q3 2023 | Q4 2023 | Q3 2023 | Q4 2023 | Q3 2023 | Q4 2023 | ||
Euro area | 8 | 4 | 3 | -1 | 11 | 4 | |
Germany | 13 | 10 | 3 | 3 | 10 | 6 | |
Spain | 25 | 8 | 25 | 8 | 25 | 8 | |
France | 8 | 8 | 8 | 8 | 17 | 0 | |
Italy | 9 | -27 | -18 | -36 | 0 | -9 | |
Note: See the notes to Chart 3.
Chart 4
Changes in terms and conditions on loans or credit lines to SMEs and large enterprises
(net percentages of banks reporting a tightening of terms and conditions)
Note: See the notes to Chart 3.
Table 3
Factors contributing to changes in overall terms and conditions on loans or credit lines to enterprises
(net percentages of banks)
Country | Cost of funds and balance sheet constraints | Pressure from competition | Perception of risk | Banks’ risk tolerance | |||||
|---|---|---|---|---|---|---|---|---|---|
Q3 2023 | Q4 2023 | Q3 2023 | Q4 2023 | Q32023 | Q4 2023 | Q3 2023 | Q4 2023 | ||
Euro area | 4 | 1 | -4 | -2 | 13 | 10 | 6 | 5 | |
Germany | 3 | 1 | -1 | 1 | 10 | 9 | 6 | 3 | |
Spain | 6 | 3 | 0 | 0 | 14 | 0 | 8 | 0 | |
France | 6 | 0 | 0 | -3 | 8 | 17 | 0 | 8 | |
Italy | 3 | 0 | -18 | -12 | 24 | 3 | 18 | 0 | |
Notes: The net percentages for these questions relating to contributing factors are defined as the difference between the percentage of banks reporting that the given factor contributed to a tightening and the percentage reporting that it contributed to an easing. See the notes to Chart 1.
2.3 Rejection rates increased
In the fourth quarter of 2023, banks reported a further net increase in the share of rejected applications for loans to firms (net percentage of 12%; see Chart 5). The net share of rejected loan applications has increased every quarter since the start of the ECB policy rate hikes in July 2022. The net increase was again larger for SMEs than for large firms (net percentages of 16% – the highest on record since the first quarter of 2022 when the series was introduced – and 9% respectively). This reflects the inherent higher credit risk of smaller firms, which is due, among other things, to lower and delayed availability of financial statements. The latest increase adds to the higher cumulative increase in the share of loan rejections for SMEs since 2022. Compared with the third quarter of 2023, the net increase in the share of rejected loan applications rose again.
Chart 5
Changes in the share of rejected loan applications for enterprises
(net percentages of banks reporting an increase)
Notes: Share of rejected loan applications relative to the volume of all loan applications in that loan category. The breakdown by firm sizes was introduced in the first quarter of 2022.
2.4 Net demand for loans continued to decrease markedly
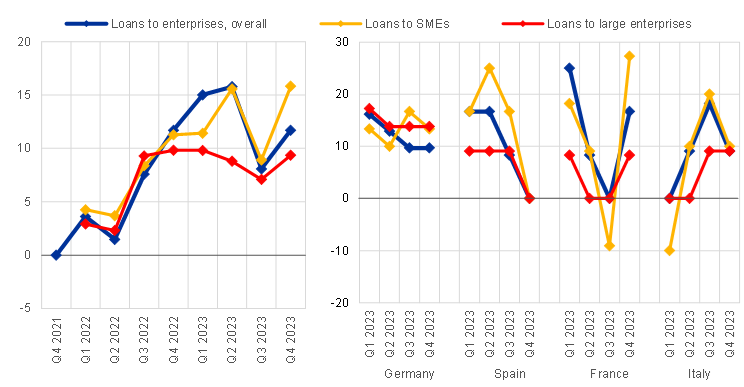
Euro area firms’ net demand for loans continued to decrease markedly in the fourth quarter of 2023 (net percentage of -20%; see Chart 6). While the net percentage decrease broadly halved compared with its all-time low in the second quarter of 2023 (-42%), the renewed decline added to the substantial net decreases in loan demand seen over the previous four quarters. The net decrease was widespread, with net declines in all four of the largest euro area economies. It was substantially smaller than in the previous quarter (-36%) and in line with euro area banks’ expectations. The net decreases in demand for loans to SMEs (-17%) and large firms (-15%) were similar and remained substantial, although smaller than in the third quarter of 2023 (-34% and -36% respectively; see Chart 7). In addition, demand for long-term loans (net percentage of -22%; see next paragraph) declined more strongly than demand for short-term loans (net percentage of -11%).
Chart 6
Changes in demand for loans or credit lines to enterprises, and contributing factors
(net percentages of banks reporting an increase in demand, and contributing factors)
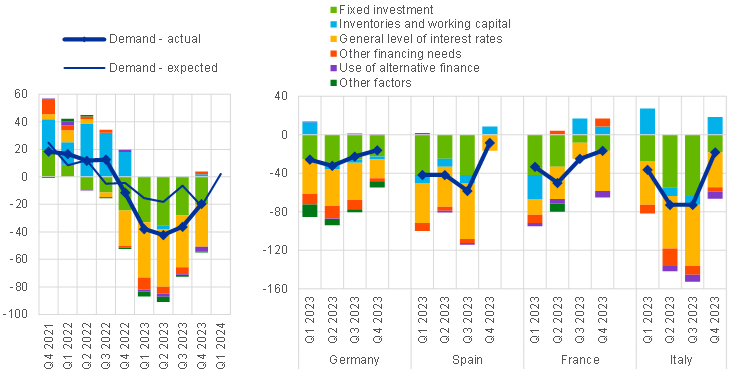
Notes: “Actual” values are changes that have occurred, while “expected” values are changes anticipated by banks. Net percentages for the questions on demand for loans are defined as the difference between the sum of the percentages of banks responding “increased considerably” and “increased somewhat” and the sum of the percentages of banks responding “decreased somewhat” and “decreased considerably”. The net percentages for responses to questions relating to contributing factors are defined as the difference between the percentage of banks reporting that the given factor contributed to increasing demand and the percentage reporting that it contributed to decreasing demand. “Other financing needs” is the unweighted average of “mergers/acquisitions and corporate restructuring” and “debt refinancing/restructuring and renegotiation”; “use of alternative finance” is the unweighted average of “internal financing”, “loans from other banks”, “loans from non-banks”, “issuance/redemption of debt securities” and “issuance/redemption of equity”. The net percentages for the “other factors” refer to an average of the further factors which were mentioned by banks as having contributed to changes in loan demand.
Chart 7
Changes in demand for loans or credit lines to SMEs and large enterprises, and contributing factors
(net percentages of banks reporting an increase in demand, and contributing factors)
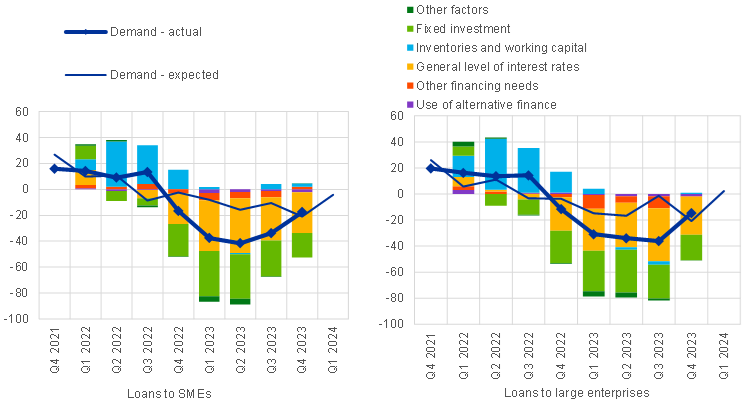
Note: See the notes to Chart 6. Developments in the factors having an impact on loan demand across firm sizes were added in the first quarter of 2022.
The higher interest rate environment and declining fixed investment remained the main drivers of the net decrease in loan demand (see Chart 6 and Table 4). The decline in loan demand was mainly driven by the general level of interest rates[8], reported by banks in all four of the largest euro area economies, and lower fixed investment, consistent with the net decrease in demand for long-term loans. By contrast, financing needs for inventories and working capital contributed slightly positively to loan demand. This was driven by developments in three of the four largest euro area economies (with the exception being Germany). Debt refinancing or restructuring also contributed positively to loan demand, while the impact of mergers and acquisitions (M&A) financing was broadly neutral at the euro area level. With respect to the four largest euro area economies, a positive impact of M&As on loan demand in France was broadly counterbalanced by a negative impact in Germany. Alternative sources of financing, such as internal financing and market-based financing via debt securities and corporate equity, dampened loan demand only slightly in the fourth quarter of 2023. This would be in line with a limited negative impact of firms’ cash buffers and market-based debt issuance on firms’ bank borrowing. For both SMEs and large firms, the general level of interest rates and firms’ financing needs for fixed investment were the main drivers of reduced loan demand (see Chart 7).
Table 4
Factors contributing to changes in demand for loans or credit lines to enterprises
(net percentages of banks)
Country | Fixed investment | Inventories and working capital | Other financing needs | General level of interest rates | Use of alternative finance | |||||
|---|---|---|---|---|---|---|---|---|---|---|
Q3 2023 | Q4 2023 | Q3 2023 | Q4 2023 | Q3 2023 | Q4 2023 | Q3 2023 | Q4 2023 | Q3 2023 | Q4 2023 | |
Euro area | -28 | -20 | 0 | 2 | -5 | 2 | -37 | -31 | -1 | -3 |
Germany | -26 | -23 | -3 | -3 | -10 | -3 | -39 | -19 | 1 | 1 |
Spain | -42 | 0 | -8 | 8 | -4 | 0 | -58 | -17 | -2 | 0 |
France | -8 | -17 | 17 | 8 | 0 | 8 | -17 | -42 | 0 | -7 |
Italy | -64 | -18 | -9 | 18 | -9 | -5 | -64 | -36 | -7 | -7 |
Note: See the notes to Chart 6.
In the first quarter of 2024, banks expect a small net increase in demand for loans to firms, for the first time since the second quarter of 2022 (net percentage of 2%). The expected net increase is related to banks’ expectations for long-term loan demand, while short-term loan demand is expected to remain unchanged. While banks’ expectations for long-term loan demand tend to predict actual developments more accurately than those for short-term loan demand, banks had underestimated the steep net decrease in long-term loan demand in 2023.
3 Loans to households for house purchase
3.1 Credit standards tightened somewhat further
Euro area banks reported a small further net tightening of credit standards on loans to households for house purchase (net percentage of banks at 2%). This tightening of credit standards followed six quarters of substantial cumulative tightening, which has contributed to the drag on loan growth. Taking the historical leading indicator properties of credit standards for loans for house purchase (about two quarters ahead of actual loan developments), the recent net tightening of credit standards can be expected to continue to put a drag on actual lending dynamics to households well into 2024. The net percentage declined relative to the third quarter of 2023 (11%) and was broadly in line with what banks had expected at that time (1%; see Chart 8 and Overview table). It was also below the historical average (6%) and the lowest net percentage since the start of the hiking cycle. The slight net tightening was driven by smaller euro area countries, with banks in each of the four largest euro area economies citing net unchanged credit standards.
Chart 8
Changes in credit standards applied to the approval of loans to households for house purchase, and contributing factors
(net percentages of banks reporting a tightening of credit standards, and contributing factors)

Notes: See the notes to Chart 1. “Cost of funds and balance sheet constraints” is the unweighted average of “banks’ capital and the costs related to banks’ capital position”, “access to market financing” and “liquidity position”; “Risk perceptions” is the unweighted average of “general economic situation and outlook”, “housing market prospects, including expected house price developments” and “borrower’s creditworthiness”; “competition” is the unweighted average of “competition from other banks” and “competition from non-banks”. The net percentages for “other factors” refer to an average of the further factors which were mentioned by banks as having contributed to changes in credit standards.
Banks’ higher risk perceptions were the main factor driving the net tightening of credit standards on housing loans (see Chart 8 and Table 5). Increased risk perceptions were primarily related to perceptions regarding housing market prospects and the general economic outlook. Banks’ risk tolerance, competition as well as banks’ cost of funds and balance sheet constraints had a broadly neutral impact.
In the first quarter of 2024, euro area banks expect a pick-up in the net tightening of credit standards on loans to households for house purchase (net percentage of 8%). Among the four largest euro area economies, the expected net tightening is most pronounced in Germany.
Table 5
Factors contributing to changes in credit standards for loans to households for house purchase
(net percentages of banks)
Country | Cost of funds and balance sheet constraints | Pressure from competition | Perception of risk | Banks’ risk tolerance | ||||
|---|---|---|---|---|---|---|---|---|
Q3 2023 | Q4 2023 | Q3 2023 | Q4 2023 | Q3 2023 | Q4 2023 | Q3 2023 | Q4 2023 | |
Euro area | 1 | 1 | -1 | -1 | 9 | 3 | 6 | 1 |
Germany | 0 | 2 | 0 | -2 | 4 | -1 | 0 | 0 |
Spain | 3 | 0 | 0 | 0 | 13 | 0 | 20 | 0 |
France | 3 | 0 | 0 | 0 | 7 | 0 | 0 | 0 |
Italy | 0 | 0 | -5 | 0 | 12 | 3 | 18 | 0 |
Note: See the notes to Chart 8.
3.2 Terms and conditions eased somewhat
Banks reported a moderate easing of their overall terms and conditions for new housing loans in the fourth quarter of 2023 (net percentage of -4%; see Chart 9 and Table 6), after seven quarters of successive, sizeable tightening. While overall terms and conditions eased, margins on average loans remained broadly unchanged and margins on riskier loans continued to widen, exerting tightening pressure on terms and conditions. Amongst the largest euro area economies, margins increased in France and Spain, with banks in those countries also reporting even tighter terms and conditions. By contrast, banks in Germany and Italy reported narrower margins on average loans and easier terms and conditions. For the euro area net percentage, banks mentioned (in “other terms and conditions”) that loan-to-value ratios tightened somewhat, while other loan size limits eased. The net percentage in the fourth quarter was lower than in the third quarter (19%) and was the first easing since the first quarter of 2022.
Chart 9
Changes in terms and conditions on loans to households for house purchase
(net percentages of banks reporting a tightening of terms and conditions)

Notes: “Margins” are defined as the spread over relevant market reference rates. “Other terms and conditions” is the unweighted average of “loan-to-value ratio”, “other loan size limits”, “non-interest rate charges” and “maturity”. The net percentages for “other factors” refer to an average of the further factors which were mentioned by banks as having contributed to changes in terms and conditions.
Table 6
Changes in terms and conditions on loans to households for house purchase
(net percentages of banks)
Country | Overall terms and conditions | Banks’ margins on average loans | Banks’ margins on riskier loans | |||
|---|---|---|---|---|---|---|
Q3 2023 | Q4 2023 | Q3 2023 | Q4 2023 | Q3 2023 | Q4 2023 | |
Euro area | 19 | -4 | 10 | 1 | 14 | 10 |
Germany | 7 | -7 | -7 | -7 | 14 | 0 |
Spain | 20 | 10 | 20 | 10 | 20 | 10 |
France | 50 | 10 | 40 | 40 | 30 | 40 |
Italy | 9 | -36 | 0 | -36 | 0 | 0 |
Note: See the notes to Chart 9.
Banks reported competition as contributing to the net easing of overall terms and conditions, outweighing a tightening impact of cost of funds and balance sheet constraints (see Table 7). Banks’ risk perceptions and risk tolerance had a (broadly) neutral impact. Cost of funds and balance sheet constraints had a tightening impact in Spain and France, while competition exerted an easing impact in Germany, France and especially Italy. Some French banks also referenced the increase in mortgage rates as exerting tightening pressure on terms and conditions.
Table 7
Factors contributing to changes in overall terms and conditions on loans to households for house purchase
(net percentages of banks)
Country | Cost of funds and balance sheet constraints | Pressure from competition | Perception of risk | Banks’ risk tolerance | ||||
|---|---|---|---|---|---|---|---|---|
Q3 2023 | Q4 2023 | Q3 2023 | Q4 2023 | Q3 2023 | Q4 2023 | Q3 2023 | Q4 2023 | |
Euro area | 19 | 7 | -10 | -13 | 6 | 0 | 3 | 1 |
Germany | 4 | 0 | -18 | -7 | 11 | 0 | 4 | 4 |
Spain | 10 | 10 | 0 | 0 | 10 | 0 | 10 | 0 |
France | 60 | 20 | -10 | -20 | 0 | 0 | 0 | 0 |
Italy | 9 | 0 | -18 | -45 | 9 | 9 | 9 | 9 |
Note: The net percentages for these questions relating to contributing factors are defined as the difference between the percentage of banks reporting that the given factor contributed to a tightening and the percentage reporting that it contributed to an easing.
3.3 Rejection rates increased
Banks reported a further net increase in the share of rejected applications for housing loans (net percentage of 6%; see Chart 10). The increase remains slightly above the long-run average of 5% (since the first quarter of 2015), albeit lower than in the previous quarter (12%). The net share of rejected loan applications has increased every quarter since the start of the ECB policy rate hikes in July 2022.
Chart 10
Changes in the share of rejected loan applications for households
(net percentages of banks reporting an increase)
Note: Share of rejected loan applications relative to the volume of all loan applications in that loan category.
3.4 Net demand for loans decreased strongly
The net decrease in demand for housing loans remained substantial in the fourth quarter of 2023 but was lower than earlier in the year (net percentage of -26%, after ‑45% in the previous quarter; see Chart 11 and Overview table). The decrease in demand was stronger than anticipated by banks in the previous quarter (net percentage of -11%) and played out across the four largest euro area economies. Actual net decreases in demand have consistently been greater than previous expectations for the same period since the fourth quarter of 2022.
Chart 11
Changes in demand for loans to households for house purchase, and contributing factors
(net percentages of banks reporting an increase in demand, and contributing factors)
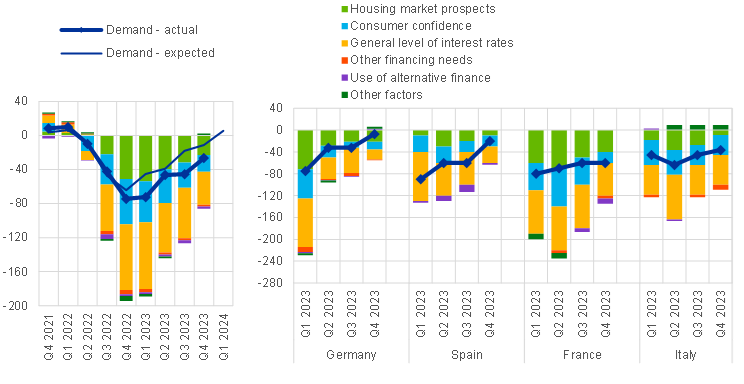
Notes: See the notes to Chart 6. “Other financing needs” is the unweighted average of “debt refinancing/restructuring and renegotiation” and “regulatory and fiscal regime of housing markets”; “use of alternative finance” is the unweighted average of “internal finance of house purchase out of savings/down payment”, “loans from other banks” and “other sources of external finance”. The net percentages for the “other factors” refer to an average of the further factors which were mentioned by banks as having contributed to changes in loan demand.
Housing loan demand declined primarily due to high interest rates, as well as weakening housing market prospects and low consumer confidence (see Chart 11 and Table 8). The general level of interest rates continued to be the main negative contributor to housing loan demand, but the net tightening impact became substantially smaller. Similarly, consumer confidence and housing market prospects had a smaller, but still sizeable negative impact in the fourth quarter of 2023. Other financing needs and the use of alternative finance (especially internal financing out of savings) contributed negatively to demand to a much smaller extent. These developments played out broadly to a similar extent across the four largest euro area economies, with only German banks citing housing market prospects rather than higher interest rates as the main dampening factor, which may be related to the strong decline in house prices in Germany.
In the first quarter of 2024, banks expect an increase in housing loan demand (net percentage of banks of 5%), which is the first time a demand increase has been expected since the first quarter of 2022.
Table 8
Factors contributing to changes in demand for loans to households for house purchase
(net percentages of banks)
Country | Housing market prospects | Consumer confidence | Other financing needs | General level of interest rates | Use of alternative finance | |||||
|---|---|---|---|---|---|---|---|---|---|---|
Q3 2023 | Q4 2023 | Q3 2023 | Q4 2023 | Q3 2023 | Q4 2023 | Q3 2023 | Q4 2023 | Q3 2023 | Q4 2023 | |
Euro area | -32 | -23 | -30 | -20 | -2 | -2 | -60 | -39 | -4 | -3 |
Germany | -21 | -21 | -11 | -14 | -5 | -2 | -46 | -18 | -1 | 2 |
Spain | -20 | -10 | -20 | -20 | 0 | 0 | -60 | -30 | -13 | -3 |
France | -50 | -40 | -50 | -20 | 0 | -5 | -80 | -60 | -7 | -10 |
Italy | -27 | -9 | -36 | -36 | -5 | -9 | -55 | -55 | 0 | 0 |
Note: See the notes to Chart 11.
4 Consumer credit and other lending to households
4.1 Credit standards tightened further
Banks reported a further net tightening of credit standards on consumer credit and other lending to households (net percentage of 11%; see Chart 12 and Overview table). The net tightening in credit standards was lower than in the third quarter of 2023 (16%), but broadly in line with banks’ expectations in that quarter (net percentage of 12%). At the same time, it remained well above the historical average (5%) and added to the tightening accumulated since the start of the hiking cycle. Credit standards increased across the four largest euro area economies.
Increased risk perceptions and banks’ lower risk tolerance mainly contributed to the net tightening of credit standards for consumer credit (see Chart 12 and Table 9).[9] This was mostly related to banks’ perceptions of the economic outlook and consumers’ creditworthiness. Banks’ cost of funds and balance sheet constraints had a broadly neutral impact.
In the first quarter of 2024, euro area banks expect a further net tightening of credit standards for consumer credit and other lending to households (net percentage of 11%), especially in Germany.
Chart 12
Changes in credit standards applied to the approval of consumer credit and other lending to households, and contributing factors
(net percentages of banks reporting a tightening of credit standards, and contributing factors)

Notes: See the notes to Chart 1. “Cost of funds and balance sheet constraints” is the unweighted average of “banks’ capital and the costs related to banks’ capital position”, “access to market financing” and “liquidity position”; “Risk perceptions” is the unweighted average of “general economic situation and outlook”, “creditworthiness of consumers” and “risk on the collateral demanded”; “competition” is the unweighted average of “competition from other banks” and “competition from non-banks”. The net percentages for “other factors” refer to an average of the further factors which were mentioned by banks as having contributed to changes in credit standards.
Table 9
Factors contributing to changes in credit standards for consumer credit and other lending to households
(net percentages of banks)
Country | Cost of funds and balance sheet constraints | Pressure from competition | Perception of risk | Banks’ risk tolerance | ||||
|---|---|---|---|---|---|---|---|---|
Q3 2023 | Q4 2023 | Q3 2023 | Q4 2023 | Q3 2023 | Q4 2023 | Q3 2023 | Q4 2023 | |
Euro area | 1 | 1 | 0 | 0 | 7 | 5 | 5 | 6 |
Germany | 0 | 2 | 0 | 0 | 4 | 0 | 0 | 0 |
Spain | 6 | 3 | 0 | 0 | 22 | 14 | 17 | 0 |
France | 0 | 0 | 0 | 0 | 7 | 5 | 7 | 7 |
Italy | 0 | 0 | 0 | 0 | 5 | 13 | 0 | 31 |
Note: See the notes to Chart 12.
4.2 Terms and conditions tightened further
Banks’ overall terms and conditions applied when granting consumer credit and other lending to households tightened further in net terms (net percentage of 7%; see Chart 13 and Table 10). Banks primarily referred to widening margins, with a slightly larger contribution from margins on riskier loans than margins on average loans. This was particularly the case for French and Italian banks. The net percentage was similar to the net percentage in the third quarter of 2023 (8%).
Banks’ cost of funds and balance sheet constraints contributed most to the net tightening of banks’ overall terms and conditions (see Table 11). Banks’ risk tolerance and risk perceptions also had an additional tightening impact, although risk perceptions contributed slightly less than in previous quarters. Competitive pressure continued to have a slight net easing impact. Main factors cited by banks were broadly similar across the four largest euro area economies, with the exception of Germany, where banks cited tightening pressure only emanating from risk perceptions and banks’ risk tolerance.
Chart 13
Changes in terms and conditions on consumer credit and other lending to households
(net percentages of banks reporting a tightening of terms and conditions)

Notes: “Margins” are defined as the spread over a relevant market reference rate. “Other terms and conditions” is the unweighted average of “size of the loan”, “non-interest rate charges” and “maturity”. The net percentages for “other factors” refer to an average of the further factors which were mentioned by banks as having contributed to changes in terms and conditions.
Table 10
Changes in terms and conditions on consumer credit and other lending to households
(net percentages of banks)
Country | Overall terms and conditions | Banks’ margins on average loans | Banks’ margins on riskier loans | |||
|---|---|---|---|---|---|---|
Q3 2023 | Q4 2023 | Q3 2023 | Q4 2023 | Q3 2023 | Q4 2023 | |
Euro area | 8 | 7 | 5 | 9 | 8 | 12 |
Germany | 0 | 0 | 4 | 7 | 0 | 4 |
Spain | 33 | 8 | 17 | -8 | 17 | 0 |
France | 7 | 14 | 7 | 21 | 14 | 29 |
Italy | 23 | 23 | 15 | 15 | 23 | 23 |
Note: See the notes to Chart 13.
Table 11
Factors contributing to changes in overall terms and conditions on consumer credit and other lending to households
(net percentages of banks)
Country | Cost of funds and balance sheet constraints | Pressure from competition | Perception of risk | Banks’ risk tolerance | ||||
|---|---|---|---|---|---|---|---|---|
Q3 2023 | Q4 2023 | Q3 2023 | Q4 2023 | Q3 2023 | Q4 2023 | Q3 2023 | Q4 2023 | |
Euro area | 11 | 8 | -4 | -3 | 8 | 4 | 3 | 5 |
Germany | 0 | 0 | 0 | 0 | 4 | 4 | 0 | 4 |
Spain | 25 | 8 | -8 | -8 | 17 | 0 | 8 | 0 |
France | 21 | 14 | -7 | -7 | 14 | 7 | 7 | 7 |
Italy | 31 | 23 | -8 | 0 | 0 | 8 | 0 | 15 |
Note: The net percentages for these questions relating to contributing factors are defined as the difference between the percentage of banks reporting that the given factor contributed to a tightening and the percentage reporting that it contributed to an easing.
4.3 Rejection rates increased
Euro area banks reported a further net increase in the share of rejected applications for consumer credit (8%; see Chart 10 above). The net increase was lower than in the previous quarter (13%) but remains elevated relative to the series average (net percentage of 3%, since the first quarter of 2015). Similarly to the other loan categories, the net share of rejected loan applications for consumer credit and other lending to households has increased every quarter since the start of the ECB policy rate hikes in July 2022.
4.4 Net demand for loans decreased moderately further
Banks reported a moderate further net decrease in demand for consumer credit and other lending to households (net percentage of banks at -7%; see Chart 14 and Overview table). This decline was smaller than the net percentage in the previous quarter (-12%), but in line with what banks had expected in that quarter (-7%). Demand declined across all four of the largest euro area economies.
Chart 14
Changes in demand for consumer credit and other lending to households, and contributing factors
(net percentages of banks reporting an increase in demand, and contributing factors)

Notes: See the notes to Chart 6. “Use of alternative finance” is the unweighted average of “internal financing out of savings”, “loans from other banks” and “other sources of external finance”. “Consumption exp. (real estate)” denotes “consumption expenditure financed through real estate-guaranteed loans”. The net percentages for the “other factors” refer to an average of the further factors which were mentioned by banks as having contributed to changes in loan demand.
Higher interest rates primarily contributed to the decrease in demand, alongside a substantial contribution from low consumer confidence (see Chart 14 and Table 12). The contribution of the use of alternative finance towards demand was broadly neutral, as banks in Spain and France cited the use of savings for financing by consumers as having a slight dampening impact on demand, albeit much less than in the past, while banks in Italy reported a slightly positive impact.
In the first quarter of 2024, banks expect a further net decrease in demand for consumer credit and other lending to households (net percentage of -6%).
Table 12
Factors contributing to changes in demand for consumer credit and other lending to households
(net percentages of banks)
Country | Spending on durable goods | Consumer confidence | Consumption exp. (real estate) | General level of interest rates | Use of alternative finance | |||||
|---|---|---|---|---|---|---|---|---|---|---|
Q3 2023 | Q4 2023 | Q3 2023 | Q4 2023 | Q3 2023 | Q4 2023 | Q3 2023 | Q4 2023 | Q3 2023 | Q4 2023 | |
Euro area | -5 | -1 | -16 | -9 | -1 | 1 | -24 | -12 | -3 | -1 |
Germany | -7 | -7 | -4 | -4 | 0 | 0 | -18 | -4 | 1 | 0 |
Spain | -8 | 0 | -25 | -17 | -8 | 0 | -33 | -17 | -11 | -3 |
France | -14 | 0 | -21 | -7 | 0 | 0 | -29 | -14 | -10 | -2 |
Italy | 8 | 8 | -23 | -8 | 0 | 0 | -31 | -23 | 0 | 3 |
Note: See the notes to Chart 14.
5 Ad hoc questions
5.1 Banks’ access to retail and wholesale funding improved[10]
Banks’ access to funding improved somewhat for money markets, long-term deposits and debt securities, while banks’ access to short-term retail funding and securitisation tightened slightly (Chart 15 and Table 13). Access to short-term retail funding continued to deteriorate, reflecting higher deposit rates and lower overnight deposit volumes. Likely reflecting declines in longer-term yields, access to long-term retail funding and debt securities funding improved, after a deterioration since the first quarter of 2023. Access via medium- to long-term debt securities improved to a slightly greater extent than the access to funding via short-term debt securities, which remained broadly unchanged. Access to money markets also improved in net terms, mainly for very short-term maturities. Instead, access to securitisation deteriorated slightly.
Chart 15
Changes in banks’ access to retail and wholesale funding
(net percentages of banks reporting a deterioration in access)

Note: The net percentages are defined as the difference between the sum of the percentages of banks responding “deteriorated considerably” and “deteriorated somewhat” and the sum of the percentages of banks responding “eased somewhat” and “eased considerably”. The last period denotes expectations indicated by banks in the current round.
Table 13
Changes in banks’ access to retail and wholesale funding
(net percentages of banks reporting a deterioration in access)
Retail funding | Money markets | Wholesale debt securities | Securiti-sation | |||||
|---|---|---|---|---|---|---|---|---|
Total | Short-term | Long-term | Total | Short-term | Medium- to long-term | |||
Q3 2023 | 7 | 11 | 2 | 2 | 2 | -2 | 6 | 3 |
Q4 2023 | -1 | 2 | -5 | -3 | -2 | -1 | -3 | 2 |
Q1 2024 | -3 | 0 | -7 | -8 | -7 | -9 | -4 | 3 |
Note: See the notes to Chart 15. The last period denotes expectations indicated by banks in the current round.
In the first quarter of 2024, banks expect access to funding to improve further across all segments, except for short-term deposits and securitisation. Banks expect the net improvement of their access to money markets, long-term retail funding and debt securities funding to improve further. Access to short-term retail funding is expected to remain unchanged and access to securitisation is expected to continue to tighten in the first quarter of 2024.
5.2 Banks increased their capital in response to regulatory and supervisory requirements [11]
Euro area banks reported an increase in their capital as well as liquid and risk-weighted assets in 2023 in response to new regulatory or supervisory requirements (see Chart 16 and Table 14). Developments in banks’ capital position were driven more by retained earnings than by capital issuance. Banks indicated that regulatory or supervisory measures had a positive impact on banks’ total assets, with a similar impact on liquid assets and risk-weighted assets. The pressure to increase liquid assets may have resulted from the overall decrease in bank liquidity as well as the renewed attention towards banks’ liquidity levels brought about by the March 2023 market turmoil, which originated in the US and Swiss banking systems. The increase in risk-weighted assets was also supported by an increase in average and riskier loans induced by regulatory and supervisory requirements. This reflects either higher risk weights due to supervisors paying more attention to the recognition of impending credit risks or higher volumes due to the phase-out of previous surcharges. Furthermore, banks indicated that regulatory or supervisory action had a broadly neutral effect on their funding conditions.
Chart 16
Impact of regulatory or supervisory action on banks’ assets, capital and funding conditions
(net percentages of banks reporting an increase)

Notes: For “total assets”, “risk-weighted assets”, “liquid assets” and “capital”, the net percentages are defined as the difference between the sum of the percentages of banks responding “increased considerably” and “increased somewhat” and the sum of the percentages for “decreased somewhat” and “decreased considerably”. For “banks’ funding conditions”, the net percentages are defined as the difference between the sum of the percentages of banks responding “experienced a considerable tightening” and “experienced a moderate tightening” and the sum of the percentages for “experienced a moderate easing” and “experienced a considerable easing”. The last period denotes expectations indicated by banks in the current round.
Table 14
Impact of regulatory or supervisory action on banks’ assets, capital and funding conditions
(net percentages of banks reporting an increase)
Total assets | Risk-weighted assets | Capital | Funding conditions | ||||||
|---|---|---|---|---|---|---|---|---|---|
Total | Liquid assets | Total | Average loans | Riskier loans | Total | Retained earnings | Capital issuance | ||
2022 | 7 | 1 | 0 | 0 | -4 | 10 | 10 | 2 | 2 |
2023 | 7 | 7 | 7 | 9 | 8 | 13 | 14 | 4 | 1 |
2024 | 3 | 0 | 11 | 11 | 4 | 11 | 15 | 6 | 2 |
Note: See the notes to Chart 16. The last period denotes expectations indicated by banks in the current round.
Supervisory or regulatory actions had a net tightening impact on banks’ credit standards and credit margins across most loan categories in 2023 (see Chart 17 and Table 15). The net tightening impact was, however, more moderate across all loan categories than in the preceding year. The impact on loans to households for house purchases was particularly contained, both for credit standards – which tightened only slightly – and for credit margins, which even eased a little as a result of regulatory and supervisory actions.
Chart 17
Impact of regulatory or supervisory action on banks’ credit standards and margins
(net percentages of banks reporting a tightening impact)
Notes: The net percentages are defined as the difference between the sum of the percentages of banks responding “tightened considerably” and “tightened somewhat” and the sum of the percentages of banks responding “eased somewhat” and “eased considerably”. Wider spread = tightened, narrower spread = eased. The last period denotes expectations indicated by banks in the current round.
Looking ahead to 2024, euro area banks expect that regulatory or supervisory actions will increase their capital positions and their risk-weighted assets, but they do not expect further pressure to increase their liquid assets. The further positive net impact on risk-weighted assets, which is expected to be larger in 2024 than in 2023, is in line with higher perceived credit risks. The expected muted impact on liquid assets may reflect that, in an environment of overall decreasing liquidity, banks do not expect regulators and supervisors to increase liquidity requirements. At the same time, the actual net impact of supervisory and regulatory actions on liquid assets has been higher than expected by banks. In addition, banks expect a slight net tightening impact of regulatory or supervisory action on funding conditions. Banks also expect that regulatory or supervisory actions will have a larger tightening impact for credit standards and credit margins across all loan categories than in 2023.
Table 15
Impact of regulatory or supervisory action on banks’ credit standards and margins
(net percentages of banks reporting a tightening impact)
Credit standards | Credit margins | |||||
|---|---|---|---|---|---|---|
2022 | 2023 | 2024 | 2022 | 2023 | 2024 | |
Loans and credit lines to SMEs | 8 | 5 | 9 | 21 | 4 | 5 |
Loans and credit lines to large enterprises | 14 | 7 | 14 | 21 | 3 | 8 |
Loans to households for house purchase | 15 | 3 | 7 | 14 | -3 | 4 |
Consumer credit and other lending to households | 9 | 5 | 6 | 8 | 1 | 4 |
Note: See the notes to Chart 17. The last period denotes expectations indicated by banks in the current round.
5.3 Perceived credit risks in banks’ loan portfolios had a tightening impact on credit standards[12]
Euro area banks reported a moderate net tightening impact of non-performing loan (NPL) ratios and other indicators of credit quality on their credit standards for loans to enterprises and consumer credit in the second half of 2023 (see Chart 18 and Table 16). The net tightening impact of banks’ perceived credit risks on credit standards for loans to firms in the second half of 2023 (3%) was below the average registered since the first half of 2018, while the net tightening impact on terms and conditions (4%) was broadly in line with this average.[13] Banks assessed credit quality risks for firms on average as contained, but there were pockets of deteriorating quality in certain segments, such as commercial real estate or construction (see Section 5.4). In addition, the net tightening impact of banks’ perceived credit risks on credit standards for consumer credit remained highest across loan categories. For housing loans, credit quality had a broadly neutral impact on both credit standards and terms and conditions.
Chart 18
Impact of banks’ NPL ratios and other indicators of credit quality on credit standards and terms and conditions
(net percentages of banks reporting a tightening impact)

Notes: Net percentages are defined as the difference between the sum of the percentages of banks responding “contributed considerably to tightening” and “contributed somewhat to tightening” and the sum of the percentages of banks responding “contributed somewhat to easing” and “contributed considerably to easing”. Until the July 2023 BLS, this question referred only to the impact of banks’ NPL ratios. The last period denotes expectations indicated by banks in the current round.
Table 16
Impact of banks’ NPL ratios and other indicators of credit quality on credit standards and terms and conditions
(net percentages of banks reporting a tightening impact)
Credit standards | Terms and conditions | |||||
|---|---|---|---|---|---|---|
Q1 2023 - Q2 2023 | Q3 2023 - Q4 2023 | Q1 2024 - Q2 2024 | Q1 2023 - Q2 2023 | Q3 2023 - Q4 2023 | Q1 2024 - Q2 2024 | |
Loans to enterprises | 6 | 3 | 7 | 6 | 4 | 5 |
Loans to households for house purchase | 0 | 1 | -1 | 1 | 0 | 0 |
Consumer credit and other lending to households | 7 | 7 | 5 | 10 | 3 | 6 |
Note: See the notes to Chart 18. The last period denotes expectations indicated by banks in the current round.
Higher risk perceptions, lower risk tolerance and higher pressure related to supervisory or regulatory requirements remained the main factors behind banks reporting a tightening impact of credit quality on their lending conditions in the second half of 2023 (see Chart 19 and Table 17). This reflects increased refinancing and repayment risks and a more prudent attitude towards credit risks in the context of higher lending rates and weak economic growth. In line with the generally sound state of euro area banks, the impact of credit quality on banks’ lending policies from banks’ capital and liquidity positions, market financing access, and cost of balance sheet clean-up was neutral in the second half of 2023.
Chart 19
Impact of factors through which NPL ratios and other indicators of credit quality affect banks’ policies on lending to enterprises and households
(net percentages of banks reporting a tightening impact)
Note: See the notes to Chart 18. The last period denotes expectations indicated by banks in the current round.
Table 17
Impact of factors through which NPL ratios and other indicators of credit quality affect banks’ policies on lending to enterprises and households
(net percentages of banks reporting a tightening impact)
Q1 2023 – Q2 2023 | Q3 2023 – Q4 2023 | Q1 2024 – Q2 2024 | |
|---|---|---|---|
Costs related to banks’ capital position | 3 | 0 | 1 |
Costs related to balance sheet clean-up operations | 3 | 0 | 2 |
Supervisory or regulatory requirements | 6 | 4 | 6 |
Access to market financing | 2 | 0 | -1 |
Liquidity position | 2 | 0 | 0 |
Perception of risk | 9 | 12 | 4 |
Banks’ risk tolerance | 12 | 6 | 5 |
Note: See the notes to Chart 18. The last period denotes expectations indicated by banks in the current round.
For the first half of 2024, euro area banks expect the credit quality of their loans to firms and consumer credit to have a further moderate tightening impact on their credit standards and a continued broadly neutral impact for housing loans. Pressure related to supervisory or regulatory requirements, lower risk tolerance and higher risk perceptions are expected to be the main drivers of credit quality affecting credit standards and terms and conditions. Banks’ credit quality is also expected to have a small tightening impact through costs related to balance sheet clean-up, whereas they expect a broadly neutral impact from their capital position and access to market financing over the next six months.
5.4 Bank lending conditions tightened further in most economic sectors[14]
Lending conditions for firms tightened moderately further in most economic sectors in the second half of 2023, ranging from almost no net tightening in services to relatively large net tightening in commercial real estate, construction and residential real estate. Credit standards and terms and conditions continued to tighten most in the commercial real estate sector (CRE), reflecting higher financing costs, falling house prices and structural changes in the CRE segment in the aftermath of the pandemic (see Chart 20 and Table 18).[15] The net tightening of credit standards and terms and conditions also remained elevated in the construction sector and the residential real estate sector (RRE) in the second half of 2023. Reflecting falling energy prices while the situation in manufacturing remained overall weak (see, for instance, the manufacturing output index in the Purchasing Managers’ Index), banks further tightened their lending conditions in the manufacturing sector, but less than in the previous two periods, especially in the energy-intensive segment. The tightening of bank lending conditions was lowest in the services sector where it was almost nil, reflecting this sector’s higher resilience compared with the weaker situation in the other economic sectors. Overall, the further net tightening of credit standards and terms and conditions became smaller in all main economic sectors.
In the first half of 2024, euro area banks expect a net tightening in credit standards and terms and conditions for loans to firms across all economic sectors. The net tightening is expected to become smaller than in the second half of 2023, except for credit standards in construction and services. The net tightening of credit standards in CRE is expected to remain very elevated over the next six months.
Chart 20
Changes in credit standards and terms and conditions for new loans to enterprises across main economic sectors
(net percentages of banks reporting a tightening)

Notes: The net percentages refer to the difference between the sum of the percentages of banks responding “tightened considerably” and “tightened somewhat” and the sum of the percentages of banks responding “eased somewhat” and “eased considerably”. The last period denotes expectations indicated by banks in the current round.
Banks reported a net decrease in demand for loans or credit lines in all main economic sectors, which remained especially pronounced in real estate and construction (see Chart 21 and Table 18). The strong decline in loan demand in the CRE and RRE sectors reflects higher financing costs, lower collateral values and structural changes in the CRE segment, which dampen loan demand. Rising lending rates and higher construction costs also dampened loan demand in the construction sector in the second half of 2023. The net decrease in loan demand was still substantial but more moderate in manufacturing, services and wholesale and retail trade.
In the first half of 2024, euro area banks expect a moderate further net decrease in loan demand in several economic sectors, mostly concentrated in real estate and construction. Loan demand is expected to decrease more moderately in the wholesale and retail sector and in RRE, while the net decrease is expected to remain somewhat more pronounced in the construction sector and CRE. Banks expect broadly unchanged loan demand in manufacturing, while they expect a moderate loan demand increase in the services sector. These expectations would overall be in line with the expected gradual recovery in euro area economic activity from the first quarter of 2024 onwards, while some pockets of vulnerabilities are expected to remain.[16]
Chart 21
Changes in demand for loans or credit lines to enterprises across main economic sectors
(net percentages of banks reporting an increase)

Notes: The net percentages refer to the difference between the sum of the percentages of banks responding “increased considerably” and “increased somewhat” and the sum of the percentages of banks responding “decreased somewhat” and “decreased considerably”. The last period denotes expectations indicated by banks in the current round.
Table 18
Changes in credit standards, terms and conditions and demand for new loans to enterprises across main economic sectors
(net percentages of banks reporting a tightening/increase)
Credit standards | Terms and conditions | Loan demand | |||||||
|---|---|---|---|---|---|---|---|---|---|
Q1 23 - Q2 23 | Q3 23 - Q4 23 | Q1 24 - Q2 24 | Q1 23 - Q2 23 | Q3 23 - Q4 23 | Q1 24 - Q2 24 | Q1 23 - Q2 23 | Q3 23 - Q4 23 | Q1 24 - Q2 24 | |
Manufacturing | 10 | 8 | 6 | 14 | 6 | 2 | -17 | -17 | -1 |
Of which: energy-intensive manufacturing | 20 | 15 | 9 | 19 | 8 | 6 | -22 | -12 | -1 |
Construction | 18 | 17 | 20 | 18 | 13 | 12 | -26 | -24 | -11 |
Services | 8 | 1 | 4 | 11 | 4 | 0 | -17 | -7 | 4 |
Wholesale and retail trade | 18 | 10 | 6 | 18 | 8 | 2 | -15 | -10 | -4 |
Commercial real estate | 30 | 30 | 28 | 26 | 26 | 15 | -42 | -39 | -11 |
Residential real estate | 19 | 13 | 12 | 26 | 17 | 10 | -41 | -34 | -5 |
Note: See the notes to Charts 20 and 21. The last period denotes expectations indicated by banks in the current round.
5.5 Decrease in excess liquidity had a limited impact [17]
Banks reported only a limited impact of the decline in excess liquidity held with the Eurosystem in the second half of 2023 on bank lending conditions. The decline in excess liquidity had a small net tightening impact on credit standards and a moderate net tightening impact on terms and conditions. A moderate net percentage of banks also reported a negative impact on loan volumes (see Chart 22 and Table 19). The negative contribution of declining excess liquidity was reported as having been similar in both short-term and long-term lending.
Looking to the first half of 2024, banks anticipate a continuation of the effects as reported in the past half year. Changes in excess liquidity are expected to continue to exert some tightening pressure on credit standards as well as terms and conditions. The effect on credit standards is expected to slightly increase, while the effect on terms and conditions is expected to moderate slightly. The effects on lending volumes are expected to remain negative, at contained levels.
Chart 22
Impact of changes in banks’ excess liquidity with the Eurosystem on bank lending
(net percentages of banks reporting a tightening impact or an increase)
Notes: The net percentages refer to the difference between the percentages of banks reporting a tightening impact or a decrease and the percentages of banks reporting an easing impact or an increase. Short-term loans are loans with an original maturity of one year or less, and long-term loans are loans that have an original maturity of more than one year, including on- and off-balance sheet credit lines. The last period denotes expectations indicated by banks in the current round.
Table 19
Impact of changes in banks' excess liquidity with the Eurosystem on bank lending
(net percentages of banks reporting a tightening impact or an increase)
Q3 2023 - Q4 2023 | Q1 2024 - Q2 2024 | |
|---|---|---|
Credit standards | 2 | 4 |
Terms and conditions | 5 | 4 |
Lending volumes | -5 | -4 |
Of which: short-term loans | -4 | -4 |
Of which: long-term loans | -5 | -4 |
Note: See the notes to Chart 22. The last period denotes expectations indicated by banks in the current round.
Annexes
See more.
© European Central Bank, 2024
Postal address 60640 Frankfurt am Main, Germany
Telephone +49 69 1344 0
Website www.ecb.europa.eu
All rights reserved. Reproduction for educational and non-commercial purposes is permitted provided that the source is acknowledged.
For specific terminology please refer to the ECB glossary (available in English only).
PDF ISSN 1830-5989, QB-BA-23-004-EN-N
HTML ISSN 1830-5989, QB-BA-23-004-EN-Q
The results reported in the January 2024 bank lending survey (BLS) relate to changes observed during the fourth quarter of 2023 and expectations for the first quarter of 2024. The survey was conducted between 8 December 2023 and 2 January 2024. A total of 157 banks were surveyed in this round, with a response rate of 100%. In addition to results for the euro area as a whole, this report contains results for the four largest euro area countries in terms of GDP (i.e. Germany, France, Italy, Spain).
For more detailed information on the bank lending survey, see Köhler-Ulbrich, P., Dimou, M., Ferrante, L. and Parle, C., “Happy anniversary, BLS – 20 years of the euro area bank lending survey”, Economic Bulletin, Issue 7, ECB, 2023, Huennekes, F. and Köhler-Ulbrich, P., “What information does the euro area bank lending survey provide on future loan developments?”, Economic Bulletin, Issue 8, ECB, 2022, and Köhler-Ulbrich, P., Hempell, H. and Scopel, S., “The euro area bank lending survey”, Occasional Paper Series, No 179, ECB.
Net percentages refer to changes over the previous three months (unless otherwise noted) and are defined as the difference between the sum of the percentages of banks responding “tightened considerably” and “tightened somewhat” and the sum of the percentages of banks responding “eased somewhat” and “eased considerably”. The net percentages for responses to questions related to the factors are defined as the difference between the percentage of banks reporting that the given factor contributed to a tightening and the percentage reporting that it contributed to an easing. “Cost of funds and balance sheet constraints” are defined as the unweighted average of “banks’ capital and the costs related to banks’ capital position”, “access to market financing” and “liquidity position”; “Risk perception” as the unweighted average of “general economic situation and outlook”, “industry or firm-specific situation and outlook/borrower’s creditworthiness” and “risk on collateral demanded”; Competition as “bank competition”, “non-bank competition” and “competition from market financing”. Owing to different sample sizes across countries, which broadly reflect the differences in the national shares in lending to the euro area non-financial private sector, the size and volatility of the net percentages cannot be directly compared across countries.
The historical average can be taken as a rough proxy for the long-term equilibrium change in credit standards over the business cycle. While it is an imperfect measure, as the euro area went through several exceptional tightening periods since the start of the BLS in 2003, such as the global financial crisis, the sovereign debt crisis and the pandemic, excluding these crisis episodes would still result in a historical average above zero (at 6-7%). Therefore, small positive net percentages – such as the 4% reported in the current round – provide less conclusive evidence for net tightening than larger changes – such as those reported in the survey rounds between the second quarter of 2022 and the third quarter of 2023. For comparison, based on the Federal Reserve System Senior Loan Officer Opinion Survey, which started in 1990, the long-term average of the net percentage tightening of credit standards for loans to firms is also positive (5% since the first quarter of 2003 and 6% since the second quarter of 1990 on average across firm sizes), pointing to a moderate tendency of banks for tightening replies over the long term.
Banks have the option to mention up to three “other factors” for some questions in the questionnaire. These “other factors” can be different items across banks and time. In the respective charts, an unweighted net percentage average of the “other factors” is shown, where the net percentage of an “other factor” series is not considered in the calculation when it is equal to zero or no bank has replied to it.
For the first quarter of 2024, 10% of the banks expected somewhat tighter credit standards and 1% expected somewhat easier credit standards. No bank expected a considerable tightening or considerable easing.
Terms and conditions are the actual terms and conditions agreed in the loan contract.
5% of the euro area banks referred to a “considerable” dampening impact of the general level of interest rates on loan demand, while 28% of the banks referred to a “somewhat” dampening impact. The weighted net tightening impact of this factor based on the diffusion index moderated to 18% in the fourth quarter of 2023, from 21% in the third quarter of 2023.
“Cost of funds and balance sheet constraints” are defined as an unweighted average of “banks’ capital and the costs related to banks’ capital position”, “access to market financing” and “liquidity position”; “Risk perceptions” as an unweighted average of “general economic situation and outlook”, “borrower’s creditworthiness” and “collateral demanded”; “Competition” as an unweighted average of “competition from other banks” and “competition from non-banks”.
The January 2024 survey included a question in which banks were asked to assess the extent to which the situation in financial markets has affected their access to retail and wholesale funding. “Retail funding” is the unweighted average of “short-term deposits (up to one year)” and “long-term (more than one year) deposits and other retail funding instruments”; “money market” refers to the interbank unsecured money market and is the unweighted average of “very short-term money market (up to 1 week)” and “short-term money market (more than 1 week)”; “wholesale debt securities” is the unweighted average of “short-term debt securities (e.g. certificates of deposit or commercial paper)” and “medium to long term debt securities (incl. covered bonds)”; “securitisation” is the unweighted average of “securitisation of corporate loans”, “securitisation of loans for house purchase” and “ability to transfer credit risk off balance sheet”.
The January 2024 BLS questionnaire included an annual ad hoc question to assess the extent to which new regulatory or supervisory requirements affected banks’ lending policies. This is ascertained by assessing the potential impact on banks’ capital, leverage, liquidity position or provisioning and the credit conditions that they apply to loans. These new requirements cover regulatory or supervisory action that has been implemented recently or that is expected to be implemented in the near future. Furthermore, banks were also asked to indicate the effects on their funding conditions. Until the January 2020 BLS, this question referred to the changes over the past/next six months. As of the January 2021 BLS, it refers to the changes over the past 12 months and over the next 12 months.
The January 2024 BLS questionnaire included a biannual ad hoc question on the impact of banks’ NPL ratios and other indicators of credit quality on changes in their lending policies. Furthermore, the question asked banks about the factors through which NPL ratios and other indicators of credit quality contributed to changes in their lending policies. Until the July 2023 BLS, this question referred only to the impact of banks’ NPL ratios. Banks were asked about the impact on loans to enterprises, loans to households for house purchase and on consumer credit and other lending to households over the past six months and over the next six months. The question was extended to “other indicators of credit quality” in January 2024. The NPL ratio is defined as the stock of gross NPLs on a bank’s balance sheet as a percentage of the gross carrying amount of loans. “Other indicators of credit quality” include, for example, Stage 2 loans (performing loans with a significant of credit risk) and loans in early arrears (loans for which payment is overdue for more than 30 and up to 90 days). Changes in credit standards and/or terms and conditions can be caused by changes in banks’ credit quality, by changes in regulation or in the bank’s assessment of the credit quality, even if the indicators have remained unchanged.
Compared with the impact on credit standards and terms and conditions from 2014-2017 (net percentages of 17% and 11%), when NPL ratios of euro area banks were considerably higher, the current tightening impact is lower. When the question was introduced in the July 2018 BLS, it asked about the impact of banks’ NPL ratio “from 2014-2017”, in addition to the impact over the past and next six months.
The January 2024 survey questionnaire included a biannual ad hoc question to collect information on changes in banks’ credit standards, overall terms and conditions and loan demand across the main economic sectors over the past and next six months. Banks were asked to report information covering five sectors: manufacturing (with a breakdown into energy-intensive manufacturing), construction (excluding real estate), services (excluding financial services and real estate), wholesale and retail trade, and real estate (including both real estate construction and real estate services).
See the special feature entitled “Real estate markets in an environment of high financing costs” in the ECB Financial Stability Review, November 2023.
See the Eurosystem Macroeconomic Projections, December 2023.
The January 2024 survey questionnaire included an ad hoc question to collect information on the impact of changes in banks' excess liquidity held with the Eurosystem on bank lending over the past six months and over the next six months. Banks’ excess liquidity with the Eurosystem are the reserves that banks hold in the ECB’s current account or deposit facility. They do not include the minimum reserve requirement. Changes in banks’ excess liquidity can occur as a result of changes in banks’ liquidity holdings within the ECB’s current account or deposit facility and/or as a result of a change in minimum reserve requirements.
-
23 January 2024