Summary
Reflecting the ongoing impact of the coronavirus (COVID-19) pandemic and mitigation measures, uncertainty surrounding expectations for euro area inflation, growth and unemployment remained elevated in the fourth quarter of 2020 ECB Survey of Professional Forecasters (SPF).[1] HICP inflation expectations were 0.3%, 0.9% and 1.3% for 2020, 2021 and 2022 respectively. Compared with the previous round, i.e. in the third quarter, they were revised down for 2020 and 2021 by 0.1 percentage points. These revisions appear to mainly reflect recent data outcomes. Respondents reported that the balance of risks to their baseline inflation outlook was largely to the downside. Longer-term inflation expectations (for 2025) were 1.7% (compared with 1.6% in the previous round). Real GDP growth expectations were revised up for 2020 by 0.5 percentage points to -7.8% but down by 0.4 percentage points to 5.3% for 2021. The expected level of GDP at the longer-term horizon (2025) remains substantially lower than that based on the path projected before the coronavirus outbreak in Europe. The balance of risks to growth was generally reported to be to the downside. While respondents continue to expect an increase in the unemployment rate in 2021 with a steady decline thereafter, they revised down their unemployment expectations for all horizons.
Table 1
Results of the SPF in comparison with other expectations and projections
(annual percentage changes, unless otherwise indicated)

1) Longer-term expectations refer to 2025 in the SPF and the Consensus Economics survey and to 2024 in the Euro Zone Barometer. Consensus Economics and Euro Zone Barometer longer-term expectations are from the October 2020 survey.
2) As a percentage of the labour force.
1 Shorter-term HICP inflation expectations largely unchanged
SPF respondents revised their inflation expectations for the current and next calendar year down slightly, but expectations for the year after next and rolling horizons were unchanged (see Chart 1). Inflation expectations for 2020 and 2021 were revised down by 0.1 percentage points to 0.3% and 0.9% respectively. These revisions appear to reflect recent inflation data rather than lower forecasts for future inflation, as expectations for the one-year and two-year ahead rolling horizons and for 2022 were unchanged (at 1.1%, 1.3% and 1.3% respectively).[2] Inflation expectations for 2021 were slightly lower than the figure projected in the September 2020 ECB staff macroeconomic projections (see Table 1).
The impact of the coronavirus (COVID-19) pandemic and mitigation measures continued to be the main factor given by respondents in conjunction with their baseline inflation expectations and surrounding risks. Respondents cited fears regarding a further widespread wave of infections and lockdowns as well as the general level of uncertainty as possible factors holding back economic activity and consequently inflation. They generally expect the negative demand impact to outweigh any possible (upward) supply-side effects.
In terms of other factors referred to, energy prices, especially oil, were considered to be a significant likely driver of the overall headline inflation profile, especially the low level in 2020 and expected pick-up in 2021. SPF respondents’ oil price assumptions (see the section entitled “Expectations for other variables” for further details) were largely unchanged from the previous round, whereas their assumed USD/EUR rate was stronger by about 5%. In addition to the relative strength of the euro exchange rate, the temporary VAT reductions announced in some countries were also mentioned as aspects weighing on inflation.
Expectations for inflation excluding energy, food, alcohol and tobacco (HICPX) continue to show a gradual upward movement (see Chart 1). Expectations for HICPX were revised down by 0.1 percentage points for both 2020 and 2021 but unchanged for 2022. As with the expectations for headline HICP, the revisions for HICPX appear to reflect recent inflation data rather than lower forecasts for future inflation, as expectations for the one-year ahead rolling horizon were actually revised up slightly. Other than for 2020, where the impact of energy is reflected, the profiles of HICP and HICPX are largely similar over all horizons, although the expected level of HICPX is approximately 0.1 percentage points lower than that for HICP at each horizon. As with their expectations for headline inflation, respondents on average see the balance of risks to their HICPX expectations as being to the downside. The SPF forecasts for HICPX in 2020 and 2021 are 0.1 percentage points below the figures projected in the September 2020 ECB staff macroeconomic projections but the same for 2022.
Chart 1
Inflation expectations: overall HICP inflation and HICP inflation excluding energy, food, alcohol and tobacco
(annual percentage changes)

Respondents reported that the overall uncertainty surrounding the outlook for inflation remained elevated and that they considered that the balance of risks to be still substantially to the downside. The main source of the elevated uncertainty and downside risk was the coronavirus and its economic impact. This included the risk of a second wave of infections and further widespread containment measures but also the risks of indirect economic scarring effects from a prolonged downturn in certain segments, notably tourism, entertainment and hospitality. Quantitative indicators of uncertainty for inflation derived from the reported probability distributions remained elevated for all horizons but particularly for the shorter horizons.[3] The aggregate probability distributions for the calendar years 2020-22 are presented in Chart 2.[4]
Chart 2
Aggregate probability distributions for expected inflation in 2020, 2021 and 2022
(x-axis: HICP inflation expectations, annual percentage changes; y-axis: probability, percentages)


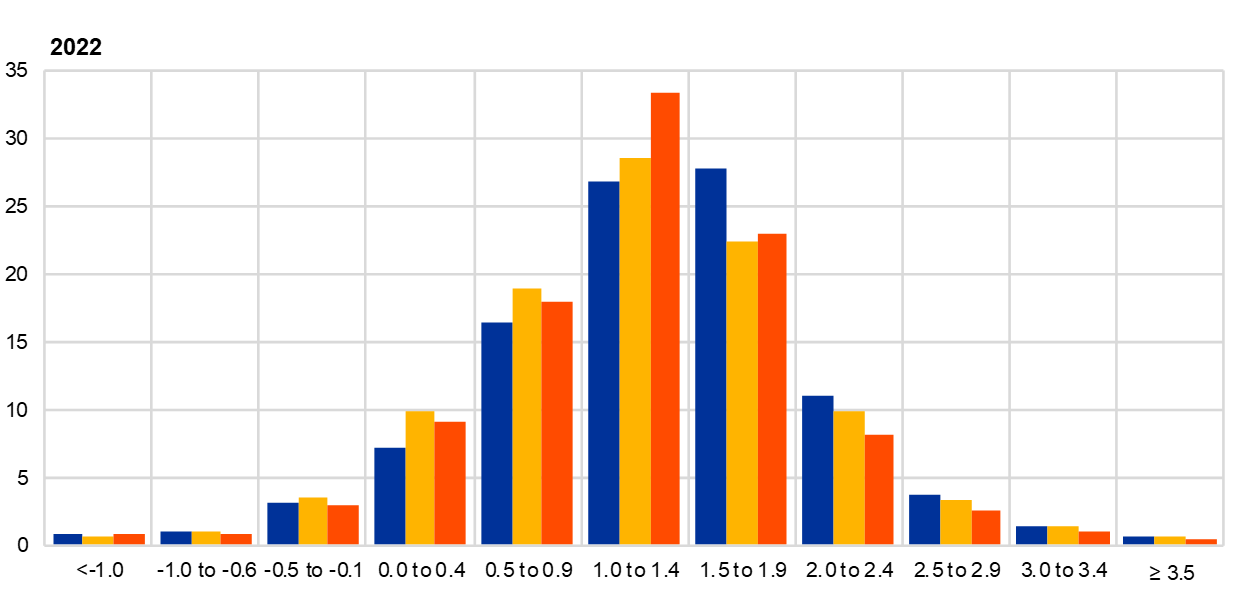
Notes: The SPF asks respondents to report their point forecasts and to separately assign probabilities to different ranges of outcomes. This chart shows the average probabilities they assigned to different ranges of inflation outcomes in 2020, 2021 and 2022.
2 Longer-term inflation expectations broadly unchanged
Longer-term inflation expectations, i.e. for 2025, averaged 1.7%, compared with 1.6% in the previous round. The upward revision was beyond the first decimal and very marginal. Taking a slightly longer perspective, following four rounds of downward revisions in 2019 by a cumulative 0.2 percentage points, average longer-term expectations remained at historical low levels in a narrow range (1.64-1.67%) during 2020. In terms of other summary statistics, the median point forecast and the estimated mean of the aggregate probability distribution were both at 1.6% (see Chart 3). The distribution of individual point forecasts was largely similar to that observed since the first quarter of 2019, with the modal response unchanged at 1.6% (see Chart 4).
The longer-term expectations for HICP inflation excluding energy, food, alcohol and tobacco (HICPX) were at 1.5% for 2025, unchanged from the previous round. The evolution of longer-term expectations for HICP and HICPX inflation has been broadly similar since the fourth quarter of 2016, the period for which HICPX expectations data are available, although the former have been slightly higher, by 0.1 percentage points on average. This was also the case in the fourth quarter 2020, where the difference was 0.11 percentage points. The apparent difference of 0.2 percentage points is due to rounding conventions.
Chart 3
Longer-term inflation expectations
(annual percentage changes)

Chart 4
Distribution of point expectations for HICP inflation in the longer term
(x-axis: longer-term HICP inflation expectations, annual percentage changes; y-axis: percentages of respondents)

Notes: The SPF asks respondents to report their point forecasts and to separately assign probabilities to different ranges of outcomes. This chart shows the spread of point forecast responses.
Perceptions of uncertainty surrounding longer-term inflation expectations remained elevated and the balance of risks stayed clearly to the downside. In line with their overall assessment that uncertainty has risen, the width of forecasters’ probability distributions for inflation in the longer term stayed at a high level. The probability associated with longer-term inflation being negative was unchanged at 3.0% (see Chart 5).
Chart 5
Aggregate probability distribution for longer-term inflation expectations
(x-axis: HICP inflation expectations, annual percentage changes; y-axis: probability, percentages)

Notes: The SPF asks respondents to report their point forecasts and to separately assign probabilities to different ranges of outcomes. This chart shows the average probabilities they assigned to different ranges of inflation outcomes in the longer term.
In the context of the current review of the ECB’s monetary policy strategy, SPF respondents were asked “what is the level or range of inflation that, according to your view, is in line with the ECB’s price stability objective?”[5] Nearly all respondents to the question – see Figure A – believed the objective to be flexible, i.e. a range rather than a single point value. Although there was some heterogeneity, the median respondent interpreted the ECB’s price stability objective as 1.7-2.0% as the median lower and higher limits of the range were 1.7% and 2.0% respectively. Figure B, which shows the histogram of inflation levels respondents said they considered to be in line with the ECB’s price stability objective, presents essentially the same information as Figure A but from a different perspective. From this it can be seen that 100% of those responding to the special question considered 1.8% and 1.9% as being consistent with the ECB’s definition of price stability. More than 75% also considered 1.7% and 2.0% to be consistent. Outside of these values, the proportion drops substantially.
Figure A
Answers to the special question “What is the level or range of inflation that, according to your view, is in line with the ECB’s price stability objective?”
(y-axis: annual percentage changes)
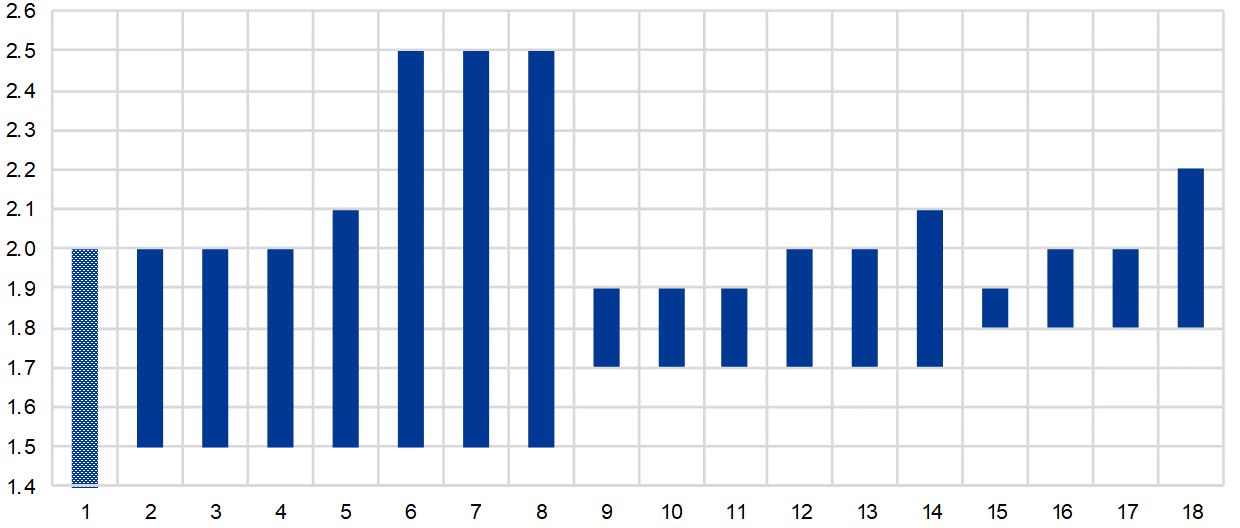
Notes: The blue bars depict the inflation rate or range of inflation rates that, according to the respondent’s view, is in line with the ECB’s price stability objective. 18 respondents provided quantitative answers to this question. The patterned bar represents a response with the range 0-2%.
Figure B
Histogram of inflation levels considered by SPF respondents to be in line with the ECB’s price stability objective
(x-axis: percentage changes; y-axis: percentages of respondents)

Notes: ≤1.4% represents the response with the range 0-2%. Thus the histogram should span the entire range 0-2%, with all elements between 0.0% and 1.4% having same value of 5.6% (i.e. 1/18).
3 Real GDP growth expectations revised towards a slightly milder downturn in 2020 and rebound in 2021
SPF GDP growth expectations now stand at -7.8% for 2020, +5.3% for 2021 and +2.6% for 2022 (see Chart 6). These imply opposing revisions – an upward revision of 0.5 percentage points for 2020, a downward revision of 0.4 percentage points for 2021 and an upward revision of 0.2 percentage points for 2022 (see Table 1). The respondents mainly flagged better than expected data and the recent increase in new coronavirus infections as the reasons to revise their forecasts for 2020 and 2021. More specifically, for 2020, respondents cited the better than expected economic data for the second and third quarters of 2020 as the main factor behind the slightly less negative outlook. They noted that this also partially explained the slightly less strong rebound now expected for 2021, as it is coming from a higher base. The expected level of GDP in 2021 was 0.2 percentage points higher than was expected in the previous round. However, due to the emergence of new COVID-19 cases in the recent weeks, many forecasters now assumed a weaker fourth quarter 2020 and that the economy would remain affected by restrictions (albeit not complete lockdowns) well into 2021.
Chart 6
Expectations for real GDP growth
(annual percentage changes)

The growth expectations imply a level of GDP in 2022 below that which prevailed in 2019 and 4.5% below what had been expected in the SPF in the first quarter of 2020 (see Chart 7). Multiple forecasters specifically mentioned that their baseline was premised on one or more vaccines being available by mid-2021. On average, respondents’ expected profile for economic activity remained a flat and elongated “tick mark”, albeit somewhat shallower than expected in the previous round. Longer-term growth expectations (which refer to 2025) remained stable at 1.4%.
Chart 7
Forecast profile of real GDP level
(2019 = 100)

Notes: Growth expectations for years not surveyed (2023 and 2024 in the third quarter round and 2023 in the second quarter round) have been interpolated linearly. Grey lines denote individual forecaster profiles in the fourth quarter round. “Sep 2020 MPE” denotes the September 2020 ECB staff macroeconomic projections.
The balance of risks to the growth outlook was generally reported as being to the downside. In their qualitative comments the majority of respondents continued to focus on downside risks. The most cited downside risk continued to be that of a further worsening of the pandemic, potentially resulting in new lockdowns. Second, a number of respondents cited the risk of a continued weakness of consumer spending and corporate investment and a rise in insolvencies, particularly should governments withdraw fiscal support “too soon”. Beyond domestic issues, an increasing number of respondents mentioned downside risks from a no-deal Brexit and increased tensions in trade relations between the United States and China. Upside risks mentioned related mainly to earlier than expected availability of a vaccine and to fiscal support measures, in particular the European recovery fund, which some respondents saw as possibly leading to higher productivity and higher than normal fiscal multipliers.
Chart 8
Aggregate probability distributions for GDP growth expectations for 2020, 2021 and 2022
(x-axis: real GDP growth expectations, annual percentage changes; y-axis: probability, percentages)

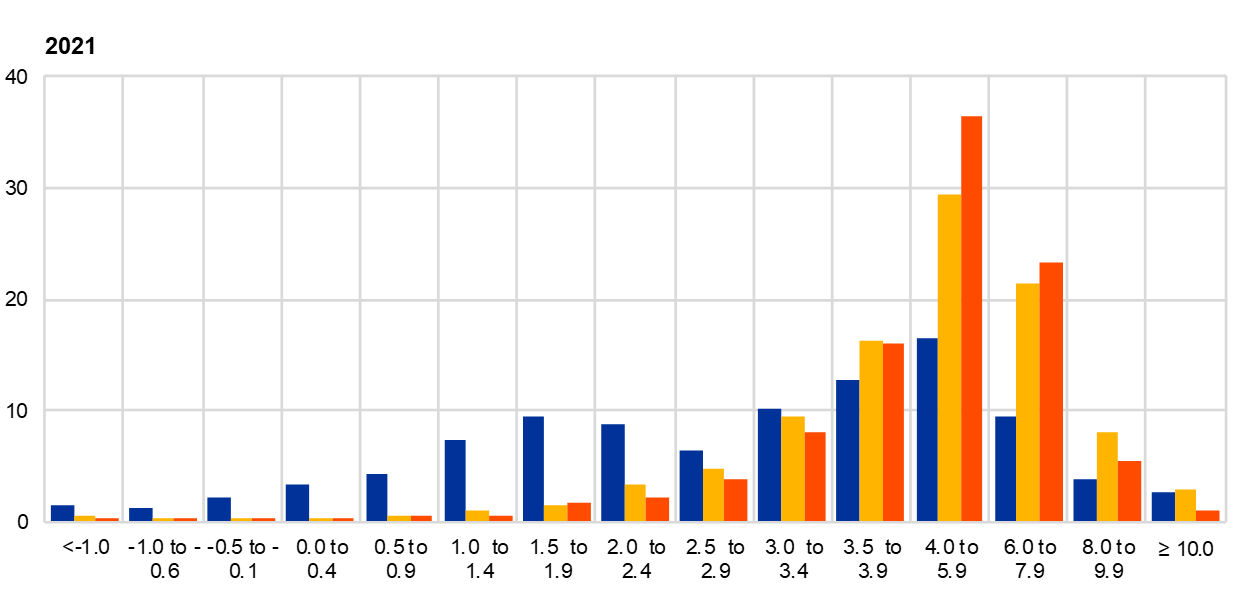

Notes: The SPF asks respondents to report their point forecasts and to separately assign probabilities to different ranges of outcomes. This chart shows the average probabilities they assigned to different ranges of real GDP growth outcomes in 2020, 2021 and 2022. In anticipation of the expected substantial revisions to the growth outlook and the considerable uncertainty surrounding them (e.g. depending on the length of the containment measures and the evolution of the spread of the virus), the SPF questionnaire was from the second quarter of 2020 adjusted to allow for a significantly wider range of the probability distributions, with bins of 2 percentage points surrounding the regular bins of earlier rounds (i.e. <-1.0% and >4.0%).
Perceived uncertainty decreased further but remains high. Although uncertainty is lower, it is still generally at levels higher than observed even during the Great Financial Crisis. For the horizons 2020-22, the disagreement among forecasters decreased further yet remains sizeable by historical comparisons. Considering specifically the reported aggregated probability distributions, with data available for the first two quarters of 2020, the highest probability in the aggregate distribution for 2020 is now clearly assigned to an annual decrease in GDP of between 7% and 9%, and the aggregate distribution is substantially more concentrated than in the previous round. Uncertainty also decreased for the expected recovery in 2021, resulting in a more clearly unimodal distribution, more concentrated around growth of between 4% and 6%. The probability distribution for 2025 remained largely unchanged. Chart 8 and Chart 9 present the aggregate probability distributions for GDP growth for the years 2020-22 and in the longer term (2025), respectively.
Chart 9
Aggregate probability distribution for longer-term GDP growth expectations
(x-axis: real GDP growth expectations, annual percentage changes; y-axis: probability, percentages)

Notes: The SPF asks respondents to report their point forecasts and to separately assign probabilities to different ranges of outcomes. This chart shows the average probabilities they assigned to different ranges of real GDP growth outcomes in the longer term.
4 Unemployment rate expectations revised down across all horizons
Respondents revised down their unemployment rate expectations for all horizons but most sharply for 2020 (see Chart 10). While this implies that there is now a steeper rise between 2020 and 2021 (to above 9%), the significant decline expected thereafter is largely unchanged compared with the previous round. Respondents indicated that the lowered expectations for 2020 reflected the impact of special measures providing temporary protection against unemployment. They also argued that these measures meant that caution was warranted when interpreting official unemployment rate statistics as indicators of slack in the labour market. The average longer-term forecast (for 2025) was, at 7.6%, 0.1 percentage points lower than in the previous round.
Chart 10
Expectations for the unemployment rate
(percentages of the labour force)

Uncertainty surrounding unemployment rate expectations eased slightly but remained at historical highs, particularly for nearer-term horizons, and risks were considered to be on the upside. Forecasters’ uncertainty about the unemployment rate in the future (as measured by the average width or standard deviations of the reported probability distributions) eased slightly from the levels observed across all horizons in the previous round but remained elevated by historical standards (see Chart 11 and Chart 12). This was particularly the case for the one-year and two-year ahead horizons. This situation reflects participants’ uncertainty about how the impact of the virus on the macroeconomy will evolve and about the impact of special protection schemes. Across all horizons, the probability distributions are skewed towards higher unemployment rate outcomes and the balance of risks is perceived to be to the upside.
Chart 11
Aggregate probability distributions for the unemployment rate in 2020, 2021 and 2022
(x-axis: unemployment rate expectations, percentages of the labour force; y-axis: probability, percentages)

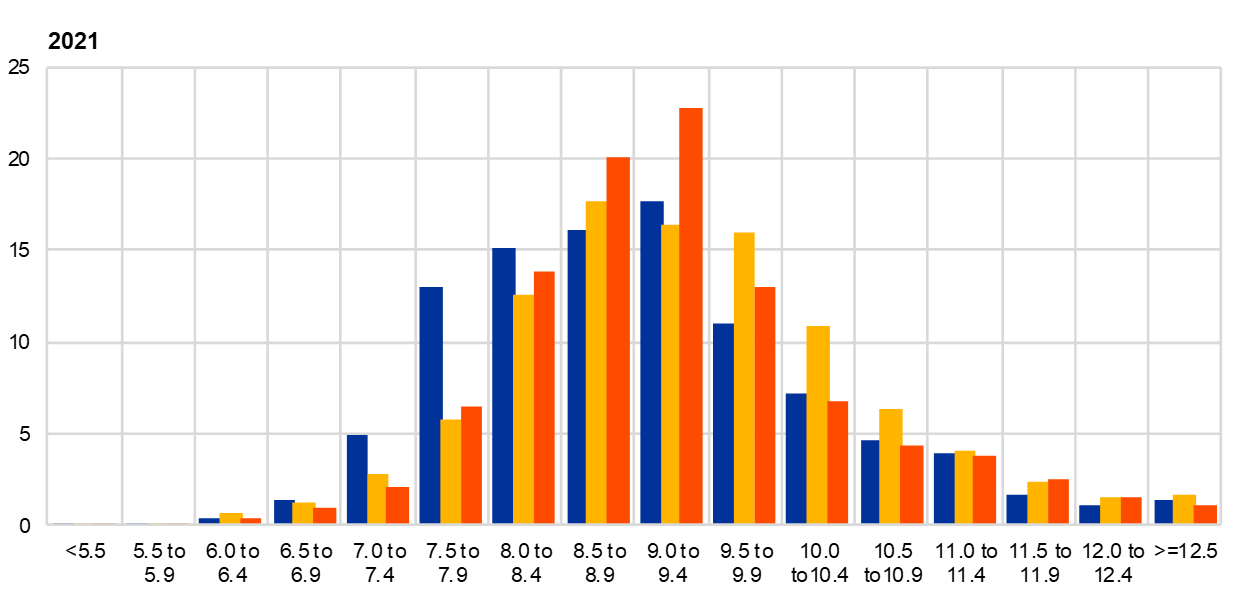

Notes: The SPF asks respondents to report their point forecasts and to separately assign probabilities to different ranges of outcomes. This chart shows the average probabilities they assigned to different ranges of unemployment rate outcomes for 2020, 2021 and 2022.
Chart 12
Aggregate probability distribution for the unemployment rate in the longer term
(x-axis: unemployment rate expectations, percentages of the labour force; y-axis: probability, percentages)

Notes: The SPF asks respondents to report their point forecasts and to separately assign probabilities to different ranges of outcomes. This chart shows the average probabilities they assigned to different ranges of unemployment rate outcomes in the longer term.
5 Expectations for other variables
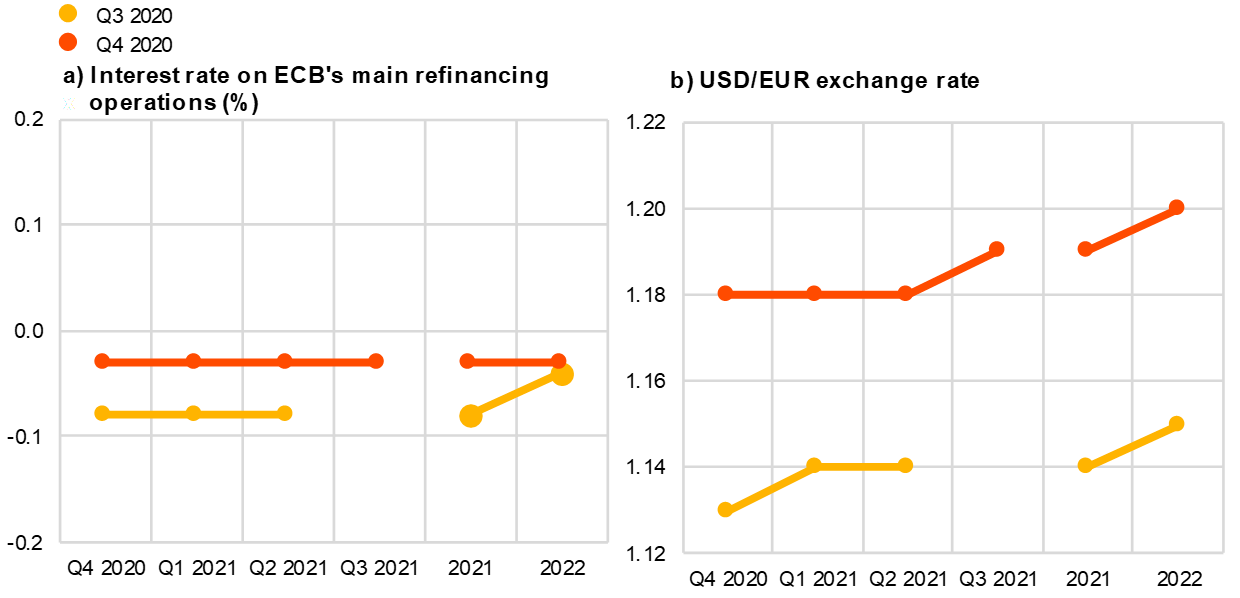
Respondents expected: (i) oil prices to increase from around USD 42 per barrel in the fourth quarter of 2020 to slightly above USD 50 per barrel by 2022; (ii) the euro to appreciate very slowly against the US dollar in the period to 2022; (iii) the ECB’s main policy rates to remain low until at least 2022; and (iv) nominal wage growth to rebound in 2021 and reach 2.4% by 2025.
The median expectation for the rate on the ECB’s main refinancing operations was for it to remain at 0% at least until 2022. As a small number (around 5%) of respondents reported expectations of negative rates, the average (mean) expectation is slightly negative. Overall, rate expectations were essentially unchanged from the previous round (see panel (a) of Chart 13).
The average USD/EUR exchange rate was expected to appreciate very marginally, from around 1.18 in the fourth quarter of 2020 to 1.19 in 2021, and further to 1.20 in 2022. This is slightly higher (by about 4%) than in the previous round (see panel (b) of Chart 13).
Compared with the previous round, the level of expected US dollar-denominated oil prices (per barrel) was quite similar over the entire horizon (the fourth quarter of 2020 to 2022) – see panel (c) of Chart 13. Oil price expectations for the fourth quarter of 2020, at USD 42 per barrel, were the same as reported in the previous round. Thereafter oil prices were expected to increase steadily to slightly above USD 50 by 2022, which is also similar to previously reported expectations. Given the expectation for the USD/EUR exchange rate, this implies a slightly lower profile for the oil price in euro (by 3-5%) compared with the previous round.
The profile of the average expectation for the annual growth in compensation per employee changed considerably from the previous round. This owes primarily to the statistical treatment of support schemes, which reduced the measured compensation per employee already in the data for the second quarter of 2020. The change in average compensation per employee is expected to be negative in 2020 before rebounding to be positive in 2021 and 2022 – see panel (d) of Chart 13. For 2025, it is expected to be 2.4%, 0.4 percentage points higher than in the previous round.
Chart 13
Expectations for other variables

6 Annex (chart data)
Excel data for all charts can be downloaded here.
© European Central Bank, 2020
Postal address 60640 Frankfurt am Main, Germany
Telephone +49 69 1344 0
Website www.ecb.europa.eu
All rights reserved. Reproduction for educational and non-commercial purposes is permitted provided that the source is acknowledged.
For specific terminology please refer to the ECB glossary (available in English only).
PDF ISSN 2363-3670, QB-BR-20-004-EN-N
HTML ISSN 2363-3670, QB-BR-20-004-EN-Q
- The survey was conducted between 2 and 9 October 2020 with 66 responses received. Participants were provided with a common set of the latest available data for annual HICP inflation (September 2020 flash estimates: overall inflation, -0.3%; underlying inflation 0.2%), annual GDP growth (second quarter of 2020, -14.7%) and unemployment (August 2020, 8.1%).
- In addition to calendar year forecasts (current calendar year, next calendar year, year after next and four/five years ahead), SPF panellists are also asked for their one and two-year ahead (of the latest available data) rolling horizon forecasts. In the fourth-quarter round, these were for September 2021 and September 2022 (in the third-quarter round they were for June 2021 and June 2022). The fact that the current and next calendar year forecasts were revised down while the rolling horizon forecasts were not, suggests that the downward revisions in the calendar year forecasts stem from actual inflation outcomes for July, August and September 2020.
- The width of the reported probability distributions indicates the perceived degree of uncertainty, whereas the asymmetry of the distributions indicates whether that uncertainty is more concentrated on higher or lower outturns, i.e. it measures the perceived balance of risks.
- Regarding uncertainty, it can be shown that the width (or standard deviation) of the aggregate probability distribution (i.e. “aggregate uncertainty”) is a function of the average width (or standard deviations) of the individual probability distributions (i.e. “individual uncertainty”) and standard deviation of the individual point forecasts (i.e. “disagreement”).
- 18 respondents provided quantitative information.
-
30 October 2020


