Does the G-SIB framework incentivise window-dressing behaviour? Evidence of G-SIBs and reporting banks
Published as part of the Macroprudential Bulletin 6, October 2018.
This article evaluates whether the global systemically important bank (G-SIB) framework has incentivised banks to adopt window-dressing behaviour, and whether their engagement in capital market activities has facilitated it. Window-dressing behaviour could have detrimental effects on financial stability, for at least two reasons: first, it may imply an underestimation of banks’ overall systemic importance and a distortion of the relative ranking in favour of banks that engage in more window-dressing behaviour; second, overall market functioning may be adversely affected if banks reduce the provision of certain services towards the end of the year. The evidence presented in this article suggests that both G-SIBs and banks with reporting obligations have reduced their overall risk score and some of their individual risk indicators at the end of a calendar year, both in absolute terms and relative to the other banks in the sample. The results also indicate that year-end reductions in capital market activities are a main driver of the observed window-dressing behaviour.
1 Introduction
In response to the 2008-09 financial crisis, the Basel Committee on Banking Supervision (BCBS) adopted a series of reforms[1] to improve the resilience of the banking sector. Inter alia, these reforms included an increase in the quality and quantity of regulatory capital, improved risk coverage, a leverage ratio designed as a backstop to risk-based capital requirements, the introduction of macroprudential capital buffer requirements (among others, additional capital buffers depending on banks’ systemic importance), and global standards for liquidity risk.
In order to address the negative externalities which a failure of G-SIBs could exert on the financial sector and the economy as a whole, the BCBS has also introduced capital requirements for G-SIBs, which are being phased-in in parallel with the capital conservation and countercyclical buffers (i.e. between 1 January 2016 and year-end 2018) and will become fully effective on 1 January 2019. The identification of G-SIBs follows an indicator-based approach, where the current methodology uses a set of twelve risk indicators, grouped into five risk categories, to identify G-SIBs as the banks that pose the highest risk to the stability of the financial system at the international level. The overall G-SIB score (called risk score hereafter) is based on these twelve indicators and allows the classification of G-SIBs into five equally-sized buckets, each corresponding to a different level of higher loss absorbency (HLA) requirements.[2]
In accordance with the BCBS recommendations, the European Banking Authority (EBA) has established that the assessment of G-SIBs has to be done every year, and that it must involve all the banks with a leverage ratio exposure exceeding €200 billion. Such banks are also required to disclose all the information necessary to compute the twelve indicators and their final risk score.[3] Since the G-SIB assessment is performed using year-end data, the banks involved in the exercise could have an incentive to reduce their indicators in the last quarter of the year in order to be allocated to a lower bucket with less stringent capital requirements, or to avoid being reallocated to a higher bucket with more stringent capital requirements. Such “window-dressing” behaviour could have detrimental effects on financial stability, for at least two reasons: first, it may imply an underestimation of banks’ overall systemic importance and a distortion of the relative ranking in favour of banks that engage in more window-dressing behaviour; second, overall market functioning may be adversely affected if banks reduce the provision of certain services towards the end of the year.
The purpose of this article is to evaluate whether the G-SIB framework has incentivised banks to adopt window-dressing behaviour, and whether their engagement in capital market activities has facilitated it. Different regulatory reforms could potentially encourage banks to window dress: for example, several studies have shown that the new leverage ratio requirement can incentivise banks to reduce the amount of their repo activities at the end of the year,[4] and that differences in the reporting frameworks of different jurisdictions allow for regulatory arbitrage.[5], [6] However, no empirical analyses have been performed to understand the role of the G-SIB framework in this regard. To fill this gap, this article applies multivariate panel regression models to a set of euro area banks in order to assess whether G-SIBs, or banks that are obliged to report their risk scores, have systematically decreased their risk indicators at the end of the year in the recent period. To improve identification, the study makes use of variation across banks with respect to: (i) the incentives to reduce risk indicators, exploiting the proximity of banks to a threshold separating different HLA buckets (and assuming that banks that are closer to such a threshold have greater incentives to reduce their scores); and (ii) the ability to reduce risk indicators, exploiting variation in banks’ capital market activities (and assuming that such activities can be adjusted more flexibly than other activities, and thus facilitate window-dressing behaviour).
2 Data coverage
This study relies on granular supervisory information for euro area banks (supervisory financial reporting or FINREP) to calculate the G-SIB risk indicators at quarterly frequency, which is necessary in order to identify possible window-dressing behaviour.[7] The final dataset includes quarterly data for 97 banks (22 banks with reporting obligations, of which eight are G-SIBs, and 75 banks with no reporting obligations) from the third quarter of 2014 to the last quarter of 2017. Overall, the sample includes almost €19 trillion in terms of 2017 total assets (TA), thus representing approximately 67% of the euro area banking system. Most importantly, all eight of the G-SIBs located in Europe are included in the sample; these eight banks alone account for approximately one-third of overall euro area total assets. More details on the sample can be found in Table 1.
Table 1
Banks in the sample

Source: ECB staff calculation based on FINREP data
Notes: Total assets (TA) refer to year-end 2017 and are expressed in € billions.
3 Methodology and results
The analysis is conducted following a three-step approach: first, a replication of the BCBS indicator-based methodology to derive banks’ G-SIB risk scores at a quarterly frequency is performed; second, the role of the G-SIB framework in incentivising banks’ window-dressing behaviour is tested; finally, the analysis tests the potential impact of capital market activities on banks’ window dressing.
Risk score calculation
The indicator-based measurement approach used to derive the banks’ risk scores is based on five risk categories. The risk scores have been designed to capture the systemic importance of banks through (a) their size, (b) their interconnectedness, (c) the lack of readily available substitutes or financial institution infrastructure for the services they provide, (d) their cross-jurisdictional activity and (e) their level of complexity.
Banks are allocated to different buckets according to their risk score, where each bucket corresponds to a specific requirement for HLA capacity, ranging from 1% to 3.5% additional CET1 (Common Equity Tier 1) capital. The risk scores used for allocating banks to buckets are based on end-of-year data that need to be reported by all the banks that are involved in the G-SIB assessment exercise.[8]
To understand whether the G-SIB framework has incentivised banks to adopt window-dressing behaviour, the indicators underlying the BCBS risk score need to be calculated at a higher frequency, for example at the quarterly level. To do so, this study relies on the supervisory data mentioned in the previous section, which can be used to calculate quarterly proxy variables for four of the five risk categories used for the calculation of the risk score. These proxies for the risk category scores are then aggregated into a proxy variable for the overall risk score at a quarterly frequency.[9]
The evolution of the average risk scores and size (proxied by total assets) of euro area G-SIBs is reported in Chart 1. It shows that G-SIBs are characterised by both a long-term decreasing trend in the risk scores as well as a more pronounced and systematic decrease of their risk scores in the last quarter of each year; the same systematic year-end decrease is also visible for total assets.
Chart 1
Evolution over time of average risk scores and total assets for G-SIBs
Risk scores expressed in basis points (bps), total assets expressed in € trillions

Source: ECB staff calculations based on FINREP and EBA data (Q3 2014 to Q4 2017).
Note: The dashed vertical lines indicate the last quarter of each year.
G-SIB framework as an incentive to window dress
The derivation of the risk scores at a quarterly frequency makes it possible to test whether some banks have systematically reduced their risk scores, or some of their risk indicators, at the end of a year. A temporary reduction in risk scores at the end of a year could help to: (a) reduce the likelihood of being allocated to a higher bucket, with more stringent capital requirements, with respect to the previous year; or (b) increase the likelihood of being allocated to a lower bucket with less stringent HLA requirements with respect to the previous year. Since not all banks have the obligation to derive and disclose their risk score according to the BCBS guidelines[10], the potential window-dressing behaviour might be more pronounced for G-SIBs and the banks with reporting obligations.
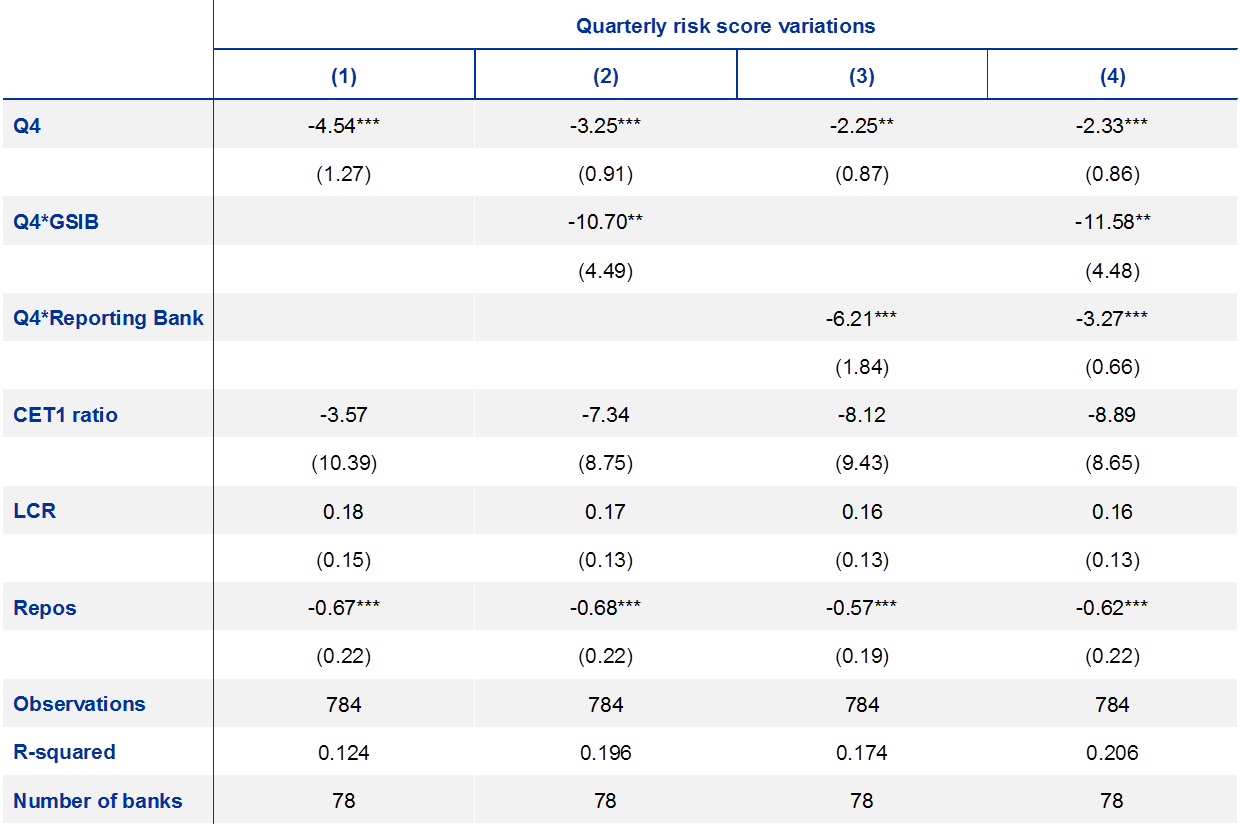
Table 2 presents the results of the multivariate panel regression model obtained by analysing the first differences of quarterly G-SIB risk scores as a function of a dummy variable identifying the last quarter of the year (Q4), the interaction term between Q4 and a dummy identifying G-SIBs (Q4*GSIB) or banks with reporting obligations (Q4*Reporting Bank) and three control variables (the CET1 ratio and the liquidity coverage ratio to account for the extent to which banks are constrained by capital and liquidity requirements; and the amount of repo activities in the previous quarter in logarithmic form to account for banks’ engagement in highly liquid capital market activities).
Table 2
Multivariate panel regression with first differences of the risk score as the dependent variable

Source: ECB staff calculation based on FINREP, COREP and EBA data (Q3 2014 to Q4 2017).
Notes: All the regressions include both time and bank fixed effects. The reported R-squared is the intra-group one. The standard errors in parenthesis are robust and adjusted for clustering at the bank level. Finally, the results reported in column (4) are obtained by simultaneously including both the interaction terms between Q4 and the dummies for G-SIBs and banks with reporting obligations, with the latter group excluding G-SIBs.
The results show a significant reduction of the G-SIB risk scores in the last quarter of the year, which is considerably more pronounced for G-SIBs and banks with reporting obligations. In particular, looking at column (4), risk scores tend to be 2.3 basis points lower on average in the last quarter, an extra 3.2 basis points lower for banks with reporting obligations, and an extra 11.6 basis points lower for G-SIBs. These magnitudes are economically meaningful, considering that the current identification threshold for G-SIBs is 130 basis points and that HLA requirements increase every 100 basis points.[11] Moreover, all results are robust with respect to the inclusion of different types of fixed effects (both time and bank-specific).
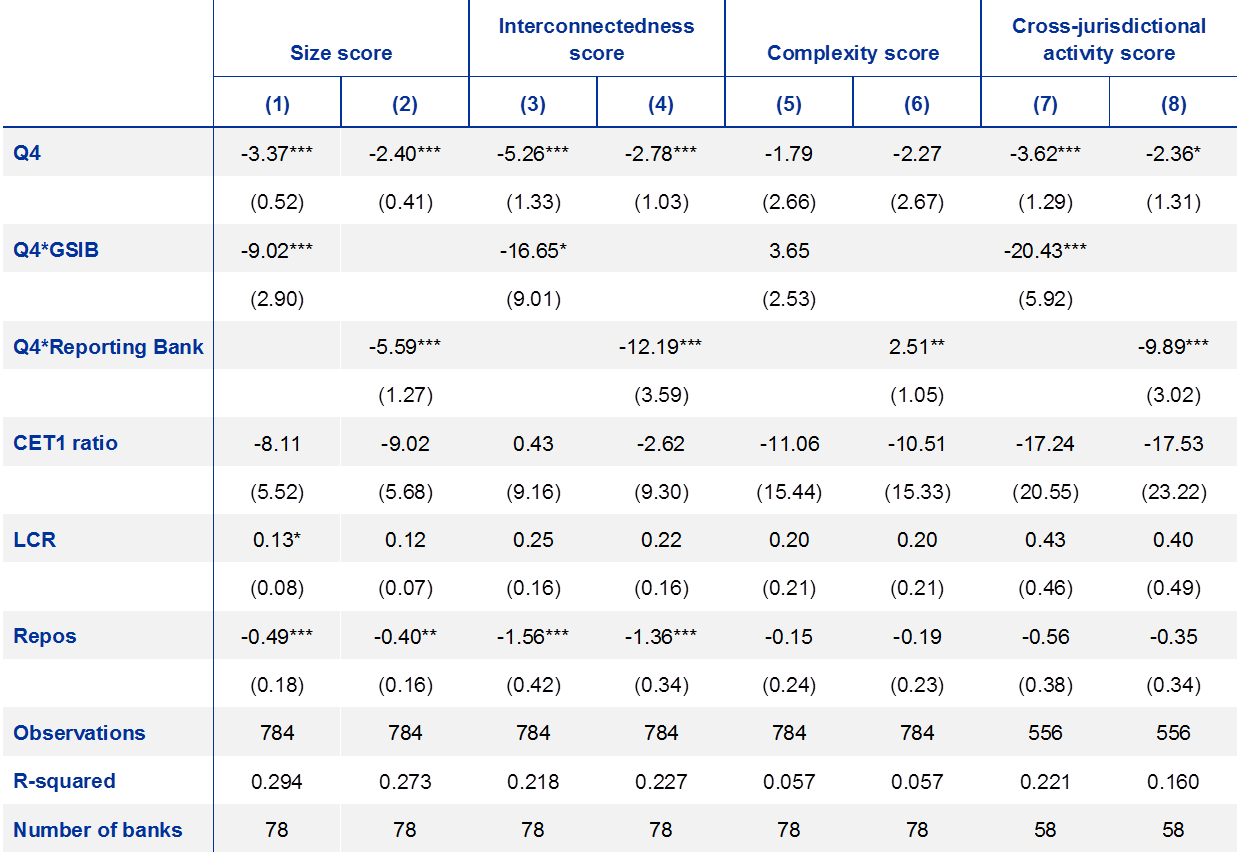
Given that the G-SIB risk score results from the weighted average of the risk scores associated with the five different risk categories, the results presented in Table 2 can be reproduced by using the quarterly variations of the risk category scores as dependent variables. The corresponding findings are reported in Table 3 and show a significant year-end decrease in the categories representing size, interconnectedness and cross-jurisdictional activity, which is significantly stronger for G-SIBs or banks with reporting obligations.[12]
Table 3
Multiple panel regression with first differences of the risk category scores as the dependent variable

Source: ECB staff calculation based on FINREP, COREP and EBA data (Q3 2014 to Q4 2017).
Notes: The dependent variables in all regressions represent quarterly variations of the risk category scores; all the regressions include both time and bank fixed effects; the reported R-squared refers to the intra-group one; the standard errors in parenthesis are robust and adjusted for clustering at the bank level.
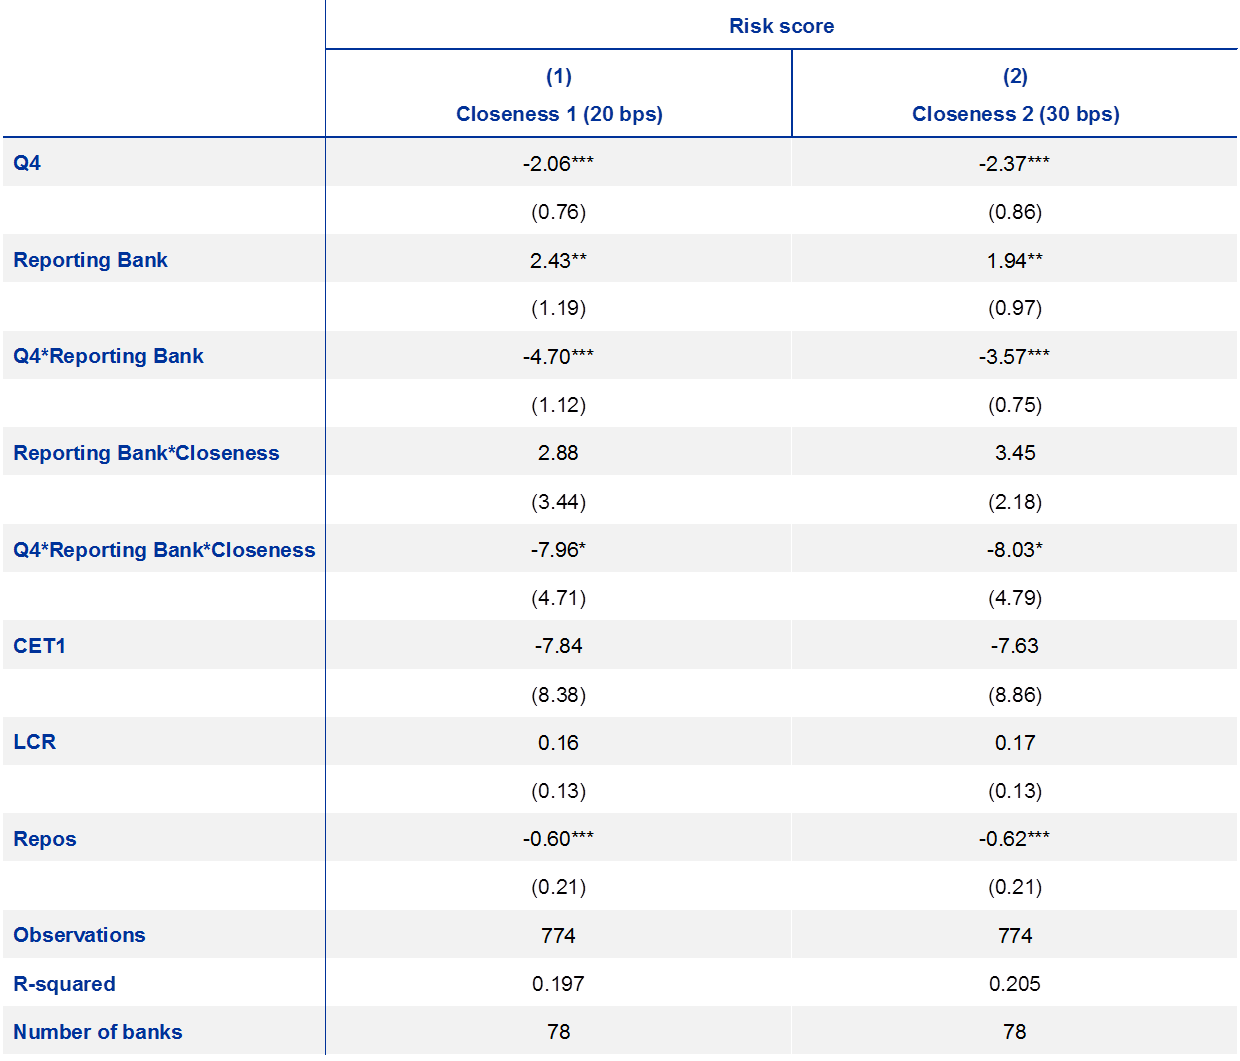
As mentioned, the determination of HLA requirements for G-SIBs is based on a threshold approach, where banks are sorted into buckets based on their scores and each bucket is associated with a corresponding HLA requirement. Against this background, banks whose risk score in the previous year was particularly close to a threshold between two different HLA buckets might attach a higher probability to movements in their score affecting their HLA requirements, and hence might have a greater incentive to window dress. The results testing this hypothesis are shown in Table 4, where Closeness 1 (Closeness 2) is a dummy variable identifying the banks whose risk score in the previous year was no more than 20 (30) basis points above or below the threshold between two different HLA buckets.[13]
Table 4
Multiple panel regression with first differences of risk scores as the dependent variable

Source: ECB staff calculation based on FINREP, COREP and EBA data (Q3 2014 to Q4 2017).
Notes: The reported R-squared refers to the intra-group one; the standard errors in parenthesis are robust and adjusted for clustering at the bank level; all the regressions include both time and bank fixed effects.
The results show that the G-SIB risk scores of banks with reporting obligations have strongly decreased in the last quarter of the year (Q4*Reporting Bank), and the decrease has been more pronounced for banks with a risk score close to a threshold between two different HLA buckets in the previous year (Q4*Reporting Bank*Closeness). Hence, greater incentives to window dress are associated with higher observed window-dressing behaviour, where the results are significant in both statistical and economic terms.
The impact of repos on window-dressing behaviour
The extent of window-dressing behaviour might depend not only on banks’ willingness to decrease their G-SIB risk score at the end of the year, but also on their ability to easily terminate some of their activities.
Repurchase agreements (repos) are short-term transactions whereby the seller of a security agrees to buy it back at a specified price and time. Given their typically extremely short maturity, repos are considered as highly liquid, and can thus facilitate window-dressing behaviour. Moreover, they often occur between financial institutions and represent a considerable share of cross-border transactions, so that reducing the amount of repos could help banks to simultaneously reduce their risk category indicators for size, intra-financial system exposures, and cross-jurisdictional activity.
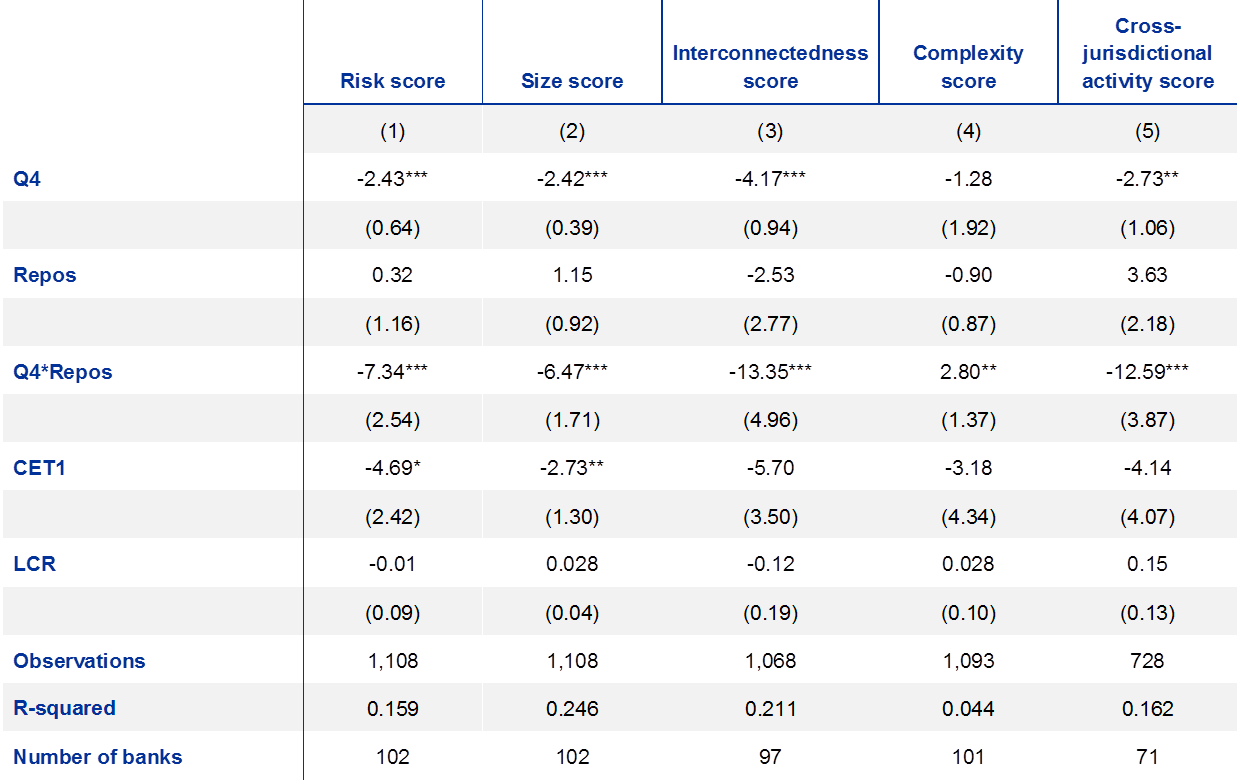
The results reported in Table 5 are based on a dummy variable, Repos, identifying the banks that, in each quarter, report an amount of repo activities above the 75th percentile for the same quarter.[14] The outcomes in column (1) confirm that banks with high levels of repo activities have decreased their G-SIB risk score approximately 7.3 basis points more than other banks in the last quarter of the year. Columns (2)-(5) also show that the impact of repos is stronger on the risk categories representing size, interconnectedness and cross-jurisdictional activity, in line with the rationale explained above and the findings reported in Table 3.
Table 5
Multivariate panel regression with first differences of risk scores and risk category scores as dependent variables

Source: ECB staff calculation based on FINREP, COREP and EBA data (Q3 2014 to Q4 2017).
Notes: All the regressions include both time and bank fixed effects; the reported R-squared refers to the intra-group one; the standard errors in parenthesis are robust and adjusted for clustering at the bank level.
4 Conclusion
The results presented in this article suggest that both G-SIBs and banks with reporting obligations have been more likely to reduce their risk score, as well as some of their risk indicators, at the end of the year relative to the other banks in the sample. Furthermore, banks that in the previous year exhibited a risk score close to the threshold between two different HLA buckets were more likely to decrease their risk score in the last quarter of the year than other banks. The second part of the analysis shows that year-end reductions in capital market activities were a main driver of the observed window-dressing behaviour.
Overall, the empirical evidence in the study suggests that the G-SIB framework has incentivised G-SIBs to decrease their risk score in the long run as intended. However, it also shows that the regulatory context might have incentivised some banks to window dress, which could distort the relative ranking of banks’ systemic importance and have adverse effects on the functioning of capital markets and the provision of financial services. Further investigation could thus be warranted to understand whether an alternative metric for the risk score calculation – based on averaging rather than year-end data – might help to avoid the unintended consequences of the G-SIB framework while guaranteeing a smooth decreasing trend in the banks’ level of risk. Such alternative metrics are already being explored for the leverage ratio framework.[15] Finally, since banks were window dressing balance sheets even before the introduction of the G-SIB framework, future research could explore whether banks’ window-dressing behaviour has become more pronounced in the recent period.
References
Bank for International Settlements (2018), “Banks’ window-dressing: the case of repo markets”, BIS Annual Economic Report, June, Box III.A, pp. 49-50.
Basel Committee on Banking Supervision (2017), “Basel III: Finalising post-crisis reforms”, Bank for International Settlements, December.
Basel Committee on Banking Supervision (2017), “Global systemically important banks – revised assessment framework”, Bank for International Settlements, June.
Basel Committee on Banking Supervision (2013), “Global systemically important banks: updated assessment methodology and the higher loss absorbency requirement”, Bank for International Settlements, July.
Grill, M., Jakovicka, J., Lambert, C., Nicoloso, P., Steininger, L. and Wedow, M. (2017), “Recent developments in euro area repo markets, regulatory reforms and their impact on repo market functioning”, Financial Stability Review, European Central Bank, Special Feature C, November.
Smith, R.M. (2016), “L’exception française: why French banks dominate US repo trading”, Risk.net, September.
For a comprehensive view of the BCBS reforms, see Basel Committee on Banking Supervision (2017), “Basel III: Finalising post-crisis reforms”, Bank for International Settlements, December.
An overview of the indicator-based approach to derive the risk scores can be found in Basel Committee on Banking Supervision (2013), “Global systemically important banks: updated assessment methodology and the higher loss absorbency requirement”, Bank for International Settlements, July, and in the latest revised version of this document Basel Committee on Banking Supervision (2017), “Global systemically important banks – revised assessment framework”, Bank for International Settlements, March.
All the G-SIB assessment samples and results can be found on this BIS webpage; for euro area banks only, data are also available on this EBA webpage.
For further details, see Grill, M., Jakovicka, J., Lambert, C., Nicoloso, P., Steininger, L. and Wedow, M. (2017), “Recent developments in euro area repo markets, regulatory reforms and their impact on repo market functioning”, Financial Stability Review, European Central Bank, Special Feature C, November; and Bank for International Settlements (2018), “Banks’ window-dressing: the case of repo markets”, BIS Annual Economic Report, June, Box III.A, pp. 49-50. In addition, contributions to the Single Resolution Fund have been cited as potentially triggering window-dressing behaviour.
While European banks are required to measure and report their leverage exposures at the end of the quarter, US banks, for example, have to calculate their leverage exposures on a daily basis (daily averaging) while UK banks have to calculate their leverage exposures on a daily basis and then average them over the quarter.
For more details on regulatory arbitrage in the context of repo transactions, see Smith, R.M. (2016), “L’exception française: why French banks dominate US repo trading”, Risk.net, September.
The focus of this study is on the G-SIB framework. In principle, incentives for banks to window dress can also arise in the frameworks for domestic systemically important banks (D-SIBs).
Within the banking union, 39 banks have the obligation to report their risk score at the end of the year, and eight of them are G-SIBs. Among the banks included in our sample (ranging from 97 to 103 depending on the reference quarter), 23 financial institutions have reporting obligations: they consist of eight G-SIBs and 15 D-SIBs.
Given that the denominators are disclosed on an annual basis and refer to year-end data, we use the publicly available denominators of the previous year to normalise the indicators’ values for the first three quarters of the following year. All the denominators are available on this BIS webpage. Since window dressing might not be specific to euro area banks, this methodology could potentially lead to an overestimation of the risk score of the banks in our sample in the interim quarters: such a concern, however, is mitigated by the fact that euro area banks have been shown to window dress more than banks in other jurisdictions, especially because of different reporting frameworks. In addition, according to the BCBS indicator-based methodology, the five risk categories used to calculate the G-SIB risk score are in turn composed of two or three risk indicators. Given that the three risk indicators relating to the substitutability category and the risk indicator representing trading and available-for-sale securities (part of the complexity category) are not available at a quarterly frequency, their missing weights are equally redistributed among the other indicators and risk categories.
The banks with reporting obligations include (a) all the banks with a Basel III leverage ratio exposure exceeding €200 billion, and (b) all the other banks, if any, that were designated as G-SIBs in the previous year but not exceeding the €200 billion leverage exposure measure.
The current cut-off score for the G-SIB designation corresponds to a G-SIB risk score at least equal to 130 bps. The five buckets have a range of 100 bps, and they imply HLA requirements that increase by 0.5% CET1 in each bucket, from the lowest (+1% CET1) to the highest (+3.5% CET1).
The three risk indicators relating to the substitutability category and the risk indicator representing trading and available-for-sale securities (part of the complexity category) are not available at a quarterly frequency. This could be the reason why window-dressing behaviour related to the complexity category is not confirmed.
The regressions reported in Table 4 focus on the Reporting Bank dummy; similar results are obtained when using the GSIB dummy, but power issues prevent the (negative) coefficient on the triple interaction from being significant.
Repo activities have been extracted from FINREP as the sum of repo liabilities towards central banks, governments, households, and financial and non-financial corporations.
See, for example, Bank for International Settlements (2018).


