Published as part of the Financial Stability Review, May 2022.
By the end of 2021, the aggregate profitability and debt positions of euro area non-financial corporations (NFCs) had recovered to pre-pandemic levels. While overall gross debt relative to gross value added remains elevated at around 160%, net debt has returned to its pre-pandemic level of around 100% of gross value added, with firms having increased precautionary cash buffers amid favourable financing conditions. However, these aggregate developments were mostly driven by large firms, while the net debt positions of small firms increased as they used credit to offset those cash flow losses that were not covered by government support measures. In addition, many corporates now face broad-based increases in input prices on the back of energy price rises and supply chain disruptions. Against this backdrop, this box uses firm-level balance sheet data for around 91,000 euro area non-financial corporations to identify vulnerable firms based on the Altman Z-score, a measure of insolvency risk that uses five balance sheet and income statement ratios and their joint importance.[1], [2], [3] It then matches bank and sovereign exposures to consider related risks associated with the sovereign-bank-corporate nexus.
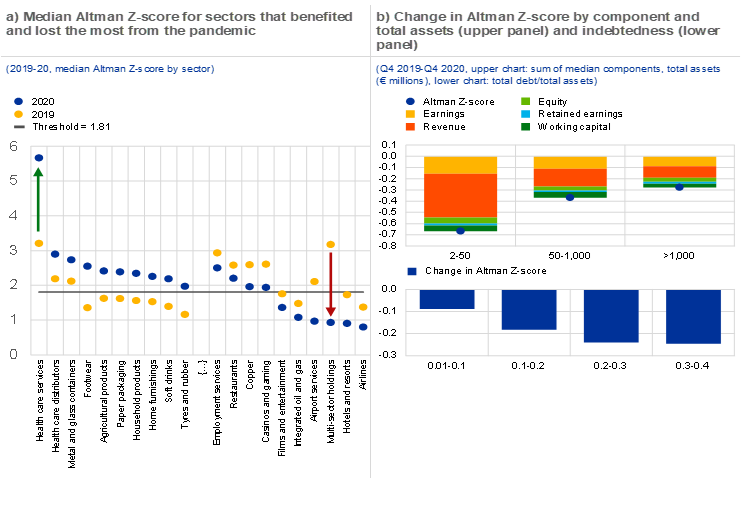
Although corporate revenues deteriorated sharply during the COVID-19 pandemic, policy support measures helped to keep insolvencies remarkably subdued. The economic effects of the pandemic have weakened firms’ balance sheets, particularly in the services sector. At the same time, firms in technology and many consumer goods sectors also benefited (Chart A, panel a). Declining revenues appear to have been the biggest driver of deteriorating financial health. Firm-level data also suggest that more leveraged firms experienced a larger decline in financial health (Chart A, panel b), and firms classified as weak had relatively higher debt, lower earnings and lower revenues than firms classified as healthy. Compared with the broad-based revenue declines, earnings and margins remained relatively resilient. This can be explained in part by government support measures.[4]
An increase in liabilities, lower liquidity levels and subdued earnings continue to pose a risk for a subset of companies. Translating Altman Z-scores into implied corporate credit ratings, the share of firms that would be rated CCC or lower increased from 7.5% in 2019 to over 9% in 2020, which is in line with the relatively benign increase in downgrades among rated firms. Overall, however, the share of vulnerable firms (those with an Altman Z-score below 1.81 or implied credit rating below BBB-) increased from 36% prior to the pandemic to 42% at the of end 2020. On balance, more firms migrated to a lower implied rating than to a higher implied rating.[5] Moreover, incoming quarterly financial results suggest that a significant share of firms had not fully recovered by mid-2021. This reflects weakness in the tourism, entertainment and aviation sectors, while larger listed firms in technology and industrial sectors benefited from strong demand and improved their cash positions.
Chart A
The financial health of smaller firms, firms with high debt levels and firms in the services sector has been more heavily affected by the pandemic, driven by weaker revenues

Sources: S&P Global Market Intelligence, ECB and ECB calculations.
Notes: Panel a: the grey line reflects the weaker firm threshold (1.81) based on the Altman Z-score as at end-2020. The Altman Z-score is calculated as 0.717 x working capital/total assets + 0.847 x retained earnings/total assets + 3.107 x EBIT/total assets + 0.420 x equity/debt + 0.998 sales/total assets. A higher Altman Z-score is associated with lower default risk. Sample size (N) = 91,649. The sample contains roughly half of the total debt outstanding for NFCs in the euro area and around 40% of total assets. The leverage ratio (total debt/total assets) for the firms in the sample is 34% compared with 30% for all euro area NFCs. Panel b: sum of the median changes in the variables included in the Altman Z-score: working capital (working capital/total assets), retained earnings (retained earnings/total assets), earnings (EBIT/total assets), revenue (sales/total assets) and equity (equity/debt). The upper chart reflects the impact on the 25th percentile of firms most affected by the pandemic in terms of Altman Z-score. The lower panel reflects the change in Altman Z-score per bucket of indebtedness measured by the firm’s total debt/total assets. The debt level is fixed on the end-2019 debt and asset level.
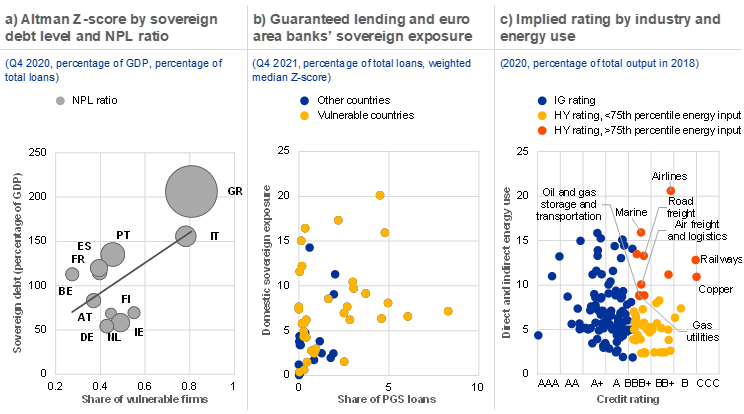
Vulnerable corporates are clustered in countries with elevated sovereign debt levels, higher non-performing loan ratios and stronger interlinkages between banks and domestic sovereigns. Euro area countries with higher sovereign debt levels also have higher shares of weaker corporates (Chart B, panel a). For those countries, the median Altman Z-scores also remain significantly below the pre-pandemic levels. In addition, spillover vulnerabilities exist in several countries due to a tighter sovereign-corporate-bank nexus. These countries tend to have higher shares of vulnerable corporates, and banks hold larger credit exposures to the domestic sovereign; at the same time, the sovereign has provided sizeable loan guarantees, notably for loans to firms in vulnerable sectors (Chart B, panel b).
Chart B
Corporate vulnerabilities are clustered in countries with elevated sovereign debt and weaker banks

Sources: OECD Trade in Value Added (TiVA) database (2018), S&P Global Market Intelligence and ECB calculations.
Notes: Panel a: a higher Altman Z-score is associated with lower default risk. The chart excludes Estonia, Cyprus, Latvia, Lithuania, Luxembourg, Malta, Slovakia and Slovenia due to low firm count in the sample. The bubble size reflects the gross NPL ratio. Sample size (N) = 91,649. Panel b: PGS stands for public guarantee scheme. Yellow circles represent low Altman Z-score countries, i.e. those with a Z-score<1.81. Panel c: converting the Altman Z-score into a credit rating is based on Table 6 in Altman E.I., op. cit. To this end, the modified Altman Z’’-score is used, which exclude a revenue component. IG stands for investment grade; HY stands for high-yield. Direct and indirect energy use is measured by the average share of input from mining and quarrying, energy producing products, coke and refined petroleum product and the electricity, gas, steam and air-conditioning industries for each sector, classified according to the United Nations International Standard Industrial Classification for All Economic Activities (ISIC), Rev. 4. This is attributed to each sector based on the 4-digit SIC code.
Weaker firms and firms with lower pricing power are more vulnerable to supply chain disruptions and rising input prices. Indices measuring input prices for euro area producers increased strongly over the course of 2021 and the first months of 2022, driven by higher energy costs and supply bottlenecks. Moreover, some key input materials showed double-digit price rises. The large increase in input prices and costs will likely put pressure on profit margins, notably for firms that have weaker pricing power and cannot easily pass on price increases. This could create cash flow challenges in the short run and undermine the debt sustainability and investment capacity in the medium term. Vulnerabilities are concentrated in firms at the intersection of lower pricing power and those with higher energy intensity of production and lower Altman Z-scores (Chart B, panel c).
All in all, corporate vulnerabilities remain and are correlated with exposures to the pandemic and the fallout from the Russian war in Ukraine. The corporate sector on aggregate proved resilient to the pandemic shock, as reflected in the recovery of profits. However, the euro area has a sizeable cohort of vulnerable smaller firms that are still recovering from the pandemic and are now facing additional cost pressures from the sharp rise in input prices observed over recent months. At the current juncture, financing conditions remain in their favour, but they could deteriorate quickly if the economy slows and lenders reassess the risks relating to certain business models. Moreover, uncertainty will reduce investment and contribute to bleaker growth prospects going forward.
For more details, see Casey, C.J., Bibeault, D. and Altman, E.I., “Corporate financial distress: A Complete guide to Predicting, Avoiding, and Dealing with Bankruptcy”, Journal of Business Strategy (pre-1986), Vol. 5, Issue 000001, 1984, p. 102f.
See also the article entitled “Assessing corporate vulnerabilities in the euro area”, Economic Bulletin, Issue 2, ECB, 2022.
The results reported in this box pertain to the specific sample at hand, which is not fully representative for the overall corporate sector as it contains relatively fewer micro firms.
See also the box entitled “The role of profit margins in the adjustment to the COVID-19 shock”, Economic Bulletin, Issue 2, ECB, 2021.
Converting the Altman Z-score into a credit rating is based on Altman, E.I., “A Fifty-Year Retrospective on Credit Risk Models, the Altman Z-Score Family of Models and their Applications to Financial Markets and Managerial Strategies”, Journal of Credit Risk, Vol. 14, No 4, 2018. For this purpose, the z’’-score is used excluding revenues.


