Summary
Reflecting the ongoing impact of the coronavirus (COVID-19) pandemic, mitigation measures and continuing uncertainties, expectations for euro area inflation, growth and unemployment were all revised further in the latest (Q3 2020) ECB Survey of Professional Forecasters (SPF).[1] HICP inflation expectations stand at 0.4%, 1.0% and 1.3% for 2020, 2021 and 2022, respectively. Compared with the previous (Q2 2020) round, these have been revised down for 2021 and 2022 by 0.2 and 0.1 percentage points. The balance of risks to the baseline inflation outlook was largely to the downside. Longer-term inflation expectations (for 2025) declined to a new historical low of 1.6% (compared with 1.7% for 2024 in the previous round). Real GDP growth expectations for 2020 were revised further down by 2.8 percentage points to -8.3%. Although real GDP is expected to increase strongly in 2021 (+5.7%, an upward revision of 0.8 percentage points) and thereafter, the growth expectations imply that the level of GDP in 2022 is below that which prevailed in 2019 and considerably lower than based on the path projected prior to the impact of the coronavirus. Uncertainty about the growth outlook remained elevated across all horizons and the balance of risks is generally to the downside. Respondents expect a significant increase in the unemployment rate in 2020 and 2021 with a steady decline thereafter. Compared with the previous round, the expected peak in unemployment now occurs in 2021 rather than in 2020.
Table 1
Results of the SPF in comparison with other expectations and projections
(annual percentage changes, unless otherwise indicated)

1) Longer-term expectations refer to 2025 in the SPF and the Consensus Economics survey and to 2024 in the Euro Zone Barometer. Consensus Economics and Euro Zone Barometer longer-term expectations are from the April 2020 survey.
2) As a percentage of the labour force.
1 Summary of respondents’ assumptions, baseline expectations and risks surrounding the economic impact of the coronavirus
On average, respondents’ baseline assumption regarding the evolution of the coronavirus pandemic is that it will be relatively contained in euro area countries, with outbreaks and associated containment measures being mainly localised in nature. Nonetheless, even with a baseline scenario of a relatively limited number of cases, respondents believe there will be a strong negative drag on activity and sentiment. Many do not see a return to more normal conditions until a vaccine/cure is developed, which they believe would not be before summer 2021. They identify the risk of a more generalised second wave as a key downside risk particularly in the autumn and winter. A number of respondents also cited the risk of a too-early withdrawal of government support measures which they considered would have a negative impact on employment and consumer behaviour. Their expected profile for economic activity remains a flat and elongated “tick-mark”, which is somewhat deeper and longer than expected in the previous (Q2) round and broadly in line with that in the baseline of the June 2020 Eurosystem staff macroeconomic projections (see Chart 1).
Chart 1
Forecast profile of real GDP level
(2019 = 100)
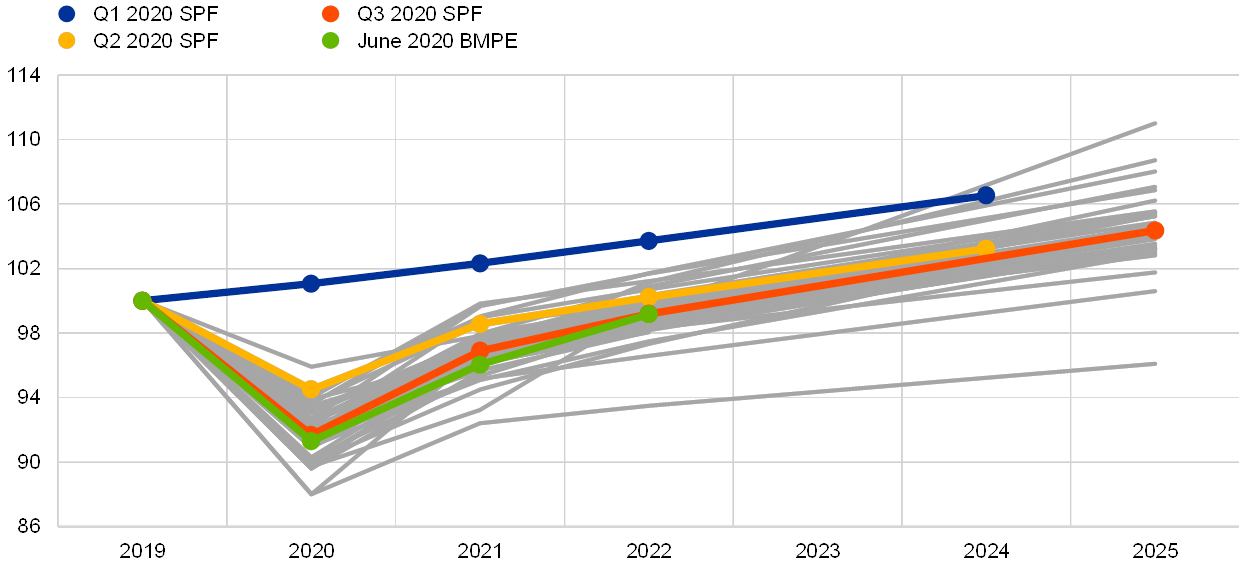
Notes: Growth expectations for years not surveyed (2023 and 2024 in the Q3 round and 2023 in the Q2 round) have been interpolated linearly. Grey lines denote individual forecaster profiles in the Q3 round. “June 2020 BMPE” denotes the June 2020 Eurosystem staff macroeconomic projections.
2 HICP inflation expectations revised down for 2021 and 2022
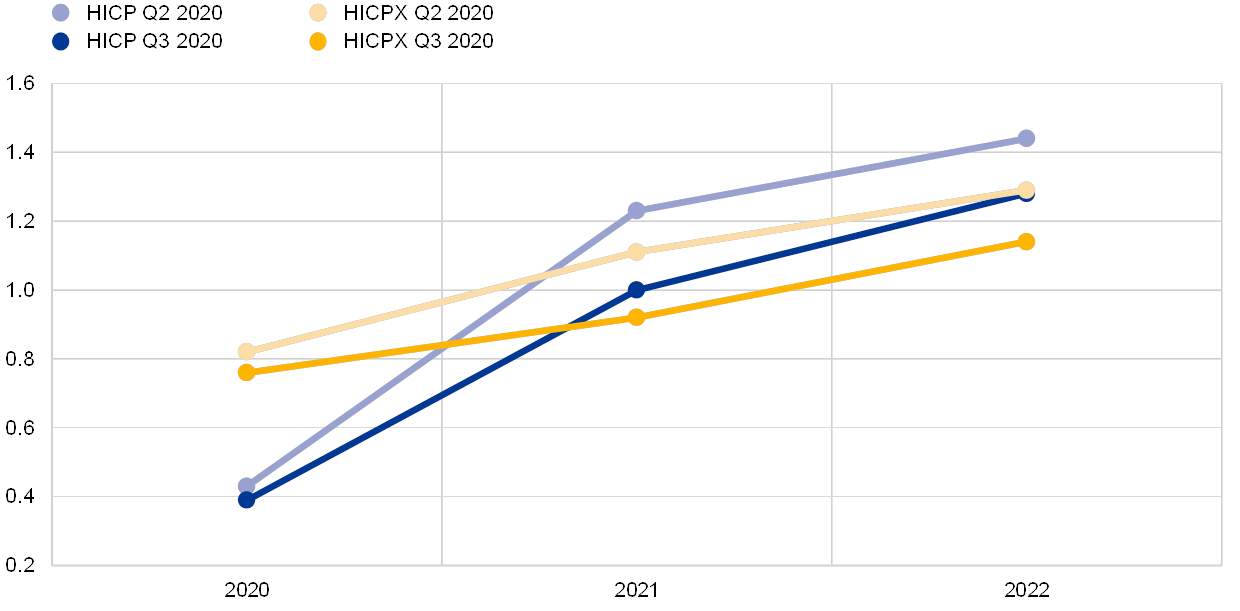
SPF respondents revised down their inflation expectations, compared with the previous round, for 2021 and 2022 by 0.2 and 0.1 percentage points to 1.0% and 1.3%, respectively (see Chart 2). Expectations for 2020 were unrevised at 0.4%. Respondents cited the impact of the coronavirus pandemic and mitigation measures on economic activity as the key factor shaping their inflation expectations path (both in terms of its profile and revisions from the previous round). Generally respondents considered that the negative demand effects would outweigh any potential upward supply-side effects. They expected that demand would be weaker owing to direct (lockdown and social distancing) effects, but also indirect (economic sentiment, precautionary saving, lower employment, etc.) effects. They foresaw some supply-side effects (such as more fragmented global value chains) which could push up prices, but considered these would be limited compared with the downward effects from demand.
Respondents noted that economic slack would be large and persistent, but its estimation was more uncertain than usual. While it was fairly likely that there would be some drag on potential output, its extent was considered to be unclear as it depended inter alia on the duration and extent of the pandemic and containment measures, and on how successful government measures put in place to support businesses and employment were. In terms of other factors affecting inflation, SPF respondents revised up their oil price assumptions (see the section entitled “Expectations for other variables” for further details), primarily for the nearer term (the third quarter of 2020). Respondents also mentioned the VAT rate cut in Germany, but noted its impact would be temporary in the second half of 2020. The overall profile of SPF inflation expectations over the period 2020-22 is broadly similar to those of the June 2020 Eurosystem staff macroeconomic projections, Consensus Economics and Euro Zone Barometer (see Table 1). Compared with the June 2020 Eurosystem staff macroeconomic projections, inflation expectations are the same for 2020 and 2022, but somewhat higher for 2021.
Expectations for HICP inflation excluding energy, food, alcohol and tobacco (HICPX) were also revised down for 2021 and 2022, but continue to exhibit a gradual upward movement (see Chart 2). Expectations for HICPX were revised down by 0.2 percentage points for both 2021 and 2022. The downward revisions mainly reflected the lower expected profile for economic activity. Over the past two SPF rounds, inflation expectations for the period 2020-22 have been revised down by 1.2 percentage points cumulatively (those for overall HICP inflation by 1.4 percentage points). On average, respondents saw the balance of risks to their HICPX expectations as being to the downside. The SPF forecasts for HICPX in 2021 and 2022 are around 0.2 percentage points above those from the June 2020 Eurosystem staff macroeconomic projections.
Chart 2
Inflation expectations: overall HICP inflation and HICP inflation excluding energy, food, alcohol and tobacco
(annual percentage changes)
Respondents reported that the overall uncertainty surrounding the outlook for inflation remained elevated and considered that the balance of risks was still substantially to the downside. Quantitative indicators of uncertainty for inflation derived from the reported probability distributions remained elevated for all horizons but most noticeably for the shorter horizons.[2] Qualitatively, the main risks reported stem from the coronavirus. Respondents mentioned the risk of a second wave of cases, but also the risk that the impact of developments so far on the economy is more severe than their baseline forecast. The aggregate probability distributions for the calendar years 2020-22 are presented in Chart 3.[3]
Chart 3
Aggregate expected probability distributions for inflation in 2020, 2021 and 2022
(x-axis: HICP inflation expectations, annual percentage changes; y-axis: probability, percentages)
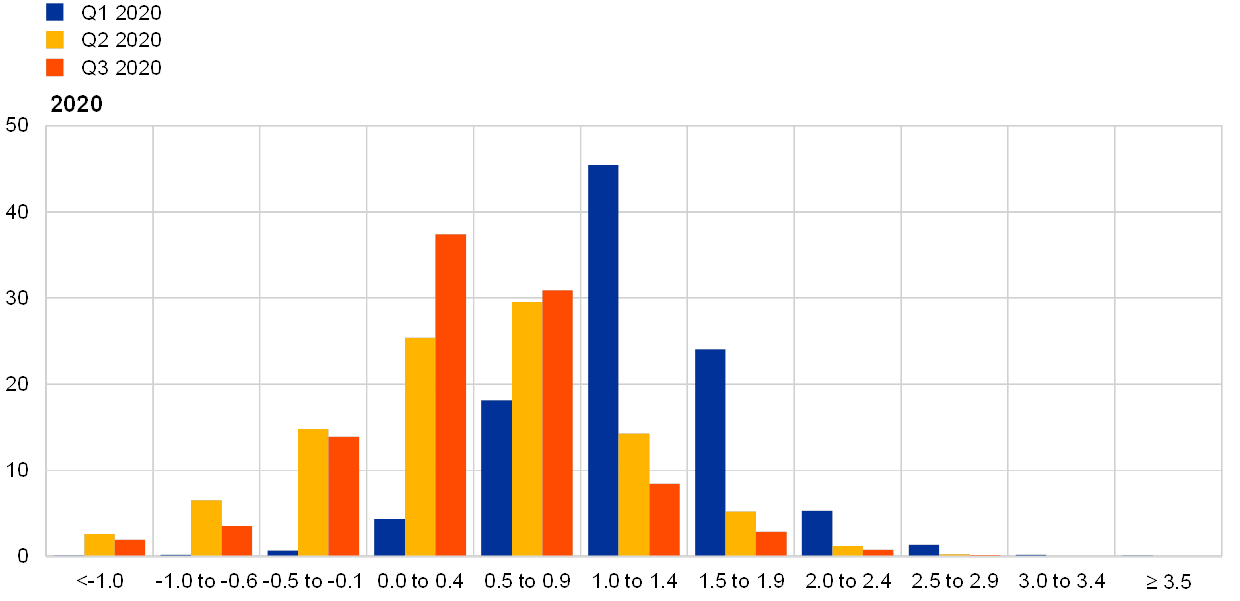


Notes: The SPF asks respondents to report their point forecasts and to separately assign probabilities to different ranges of outcomes. This chart shows the average probabilities they assigned to different ranges of inflation outcomes in 2020, 2021 and 2022.
3 Average longer-term inflation expectations edged down
Longer-term inflation expectations averaged 1.6% for 2025, compared with 1.7% for 2024 in the previous round. Although the downward revision was relatively marginal beyond the first decimal (to 1.648% from 1.669%), average longer-term expectations have been progressively revised down by over 0.2 percentage points since the Q4 2018 round when they stood at 1.88%. In terms of other summary statistics, the median point forecast and the estimated mean of the aggregate probability distribution both remained at 1.6% (see Chart 4). The distribution of individual point forecasts now also includes a number of respondents who reported longer-term inflation expectations of 1.2% (see Chart 5). The longer-term expectations for HICP inflation excluding energy, food, alcohol and tobacco (HICPX) were at 1.5% for 2025, compared with 1.6% (for 2024) in the previous round. The evolution of longer-term expectations for HICP and HICPX inflation has been broadly similar over the period for which data are available for the latter (since the fourth quarter of 2016), although the former have been slightly higher by 0.1 percentage points on average.
Chart 4
Longer-term inflation expectations
(annual percentage changes)

Chart 5
Distribution of point expectations for HICP inflation in the longer term
(x-axis: longer-term HICP inflation expectations, annual percentage changes; y-axis: percentages of respondents)

Notes: The SPF asks respondents to report their point forecasts and to separately assign probabilities to different ranges of outcomes. This chart shows the spread of point forecast responses.
Perceptions of uncertainty surrounding longer-term inflation expectations remained elevated and the balance of risks stayed strongly to the downside. In line with their overall assessment that uncertainty has risen, the width of forecasters’ probability distributions for inflation in the longer term increased to a new high level. The balance of risks remained clearly to the downside. The probability associated with longer-term inflation being negative increased marginally to 3.0% from 2.9% (see Chart 6).
Chart 6
Aggregate probability distribution of longer-term inflation expectations
(x-axis: HICP inflation expectations, annual percentage changes; y-axis: probability, percentages)
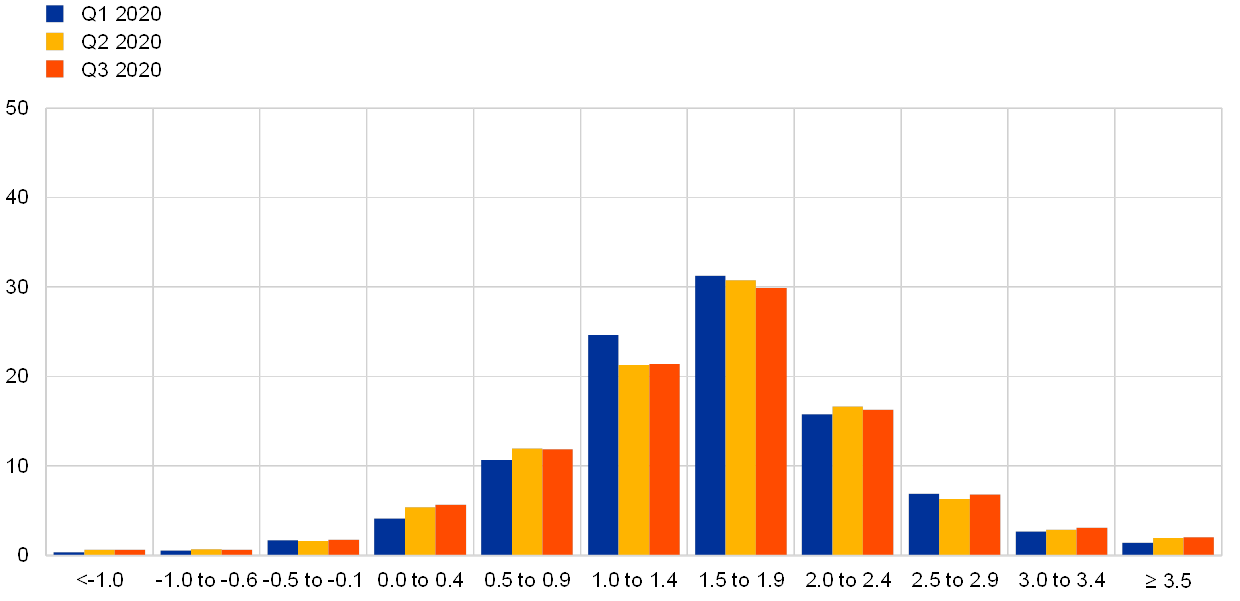
Notes: The SPF asks respondents to report their point forecasts and to separately assign probabilities to different ranges of outcomes. This chart shows the average probabilities they assigned to different ranges of inflation outcomes in the longer term.
4 Real GDP growth expectations revised towards a sharper downturn in 2020 and a slightly steeper recovery in the subsequent years
Real GDP growth expectations now stand at -8.3% for 2020, +5.7% for 2021 and +2.4% for 2022 (see Chart 7). These imply a downward revision of 2.8 percentage points for 2020 and upward revisions of 1.4 percentage points and 0.7 percentage points for 2021 and 2022, respectively. The respondents mainly flagged increased clarity in terms of data and announced monetary and fiscal support measures as reasons to revise their forecasts. With economic data for March and April coming out worse than previously expected, forecasts for 2020 were revised down. The stronger recovery in 2021 mainly reflects this lower base rather than a more positive impact from fiscal and monetary stimuli.
The growth expectations imply that the level of GDP in 2022 is below that which prevailed in 2019, around 1.0% lower than expected in the Q2 2020 SPF and 4.5% below what had been expected in the Q1 2020 SPF. For all three horizons the disagreement among forecasters decreased somewhat, yet still remains sizeable. Compared with the baseline of the June 2020 Eurosystem staff macroeconomic projections, the average SPF point forecasts are similar for 2020 and 2021, but somewhat less optimistic for 2022 (see Table 1). Longer-term growth expectations (which refer to 2025) remained stable at 1.4%.
Chart 7
Expectations for real GDP growth
(annual percentage changes)
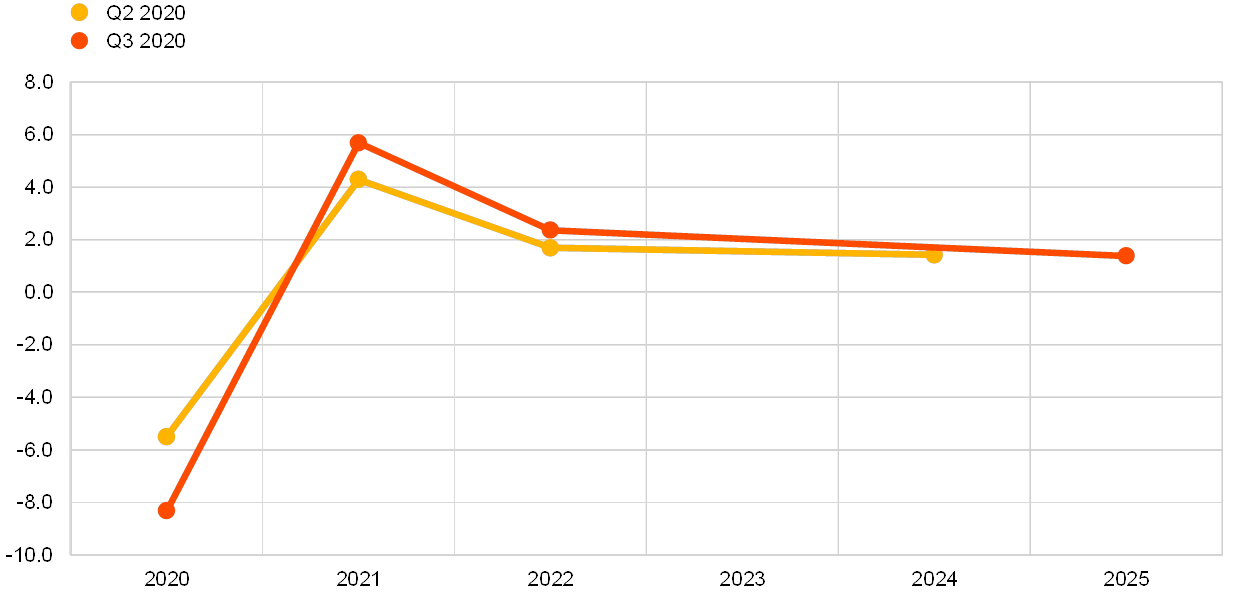
Chart 8
Aggregate probability distributions for GDP growth expectations for 2020, 2021 and 2022
(x-axis: real GDP growth expectations, annual percentage changes; y-axis: probability, percentages)
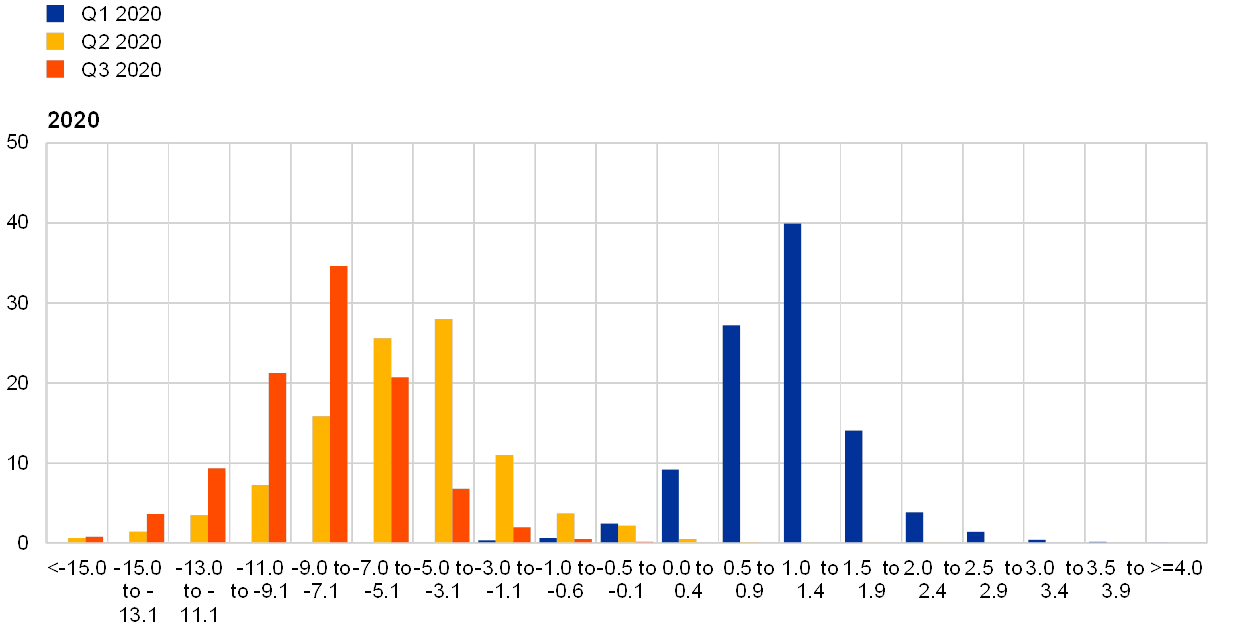

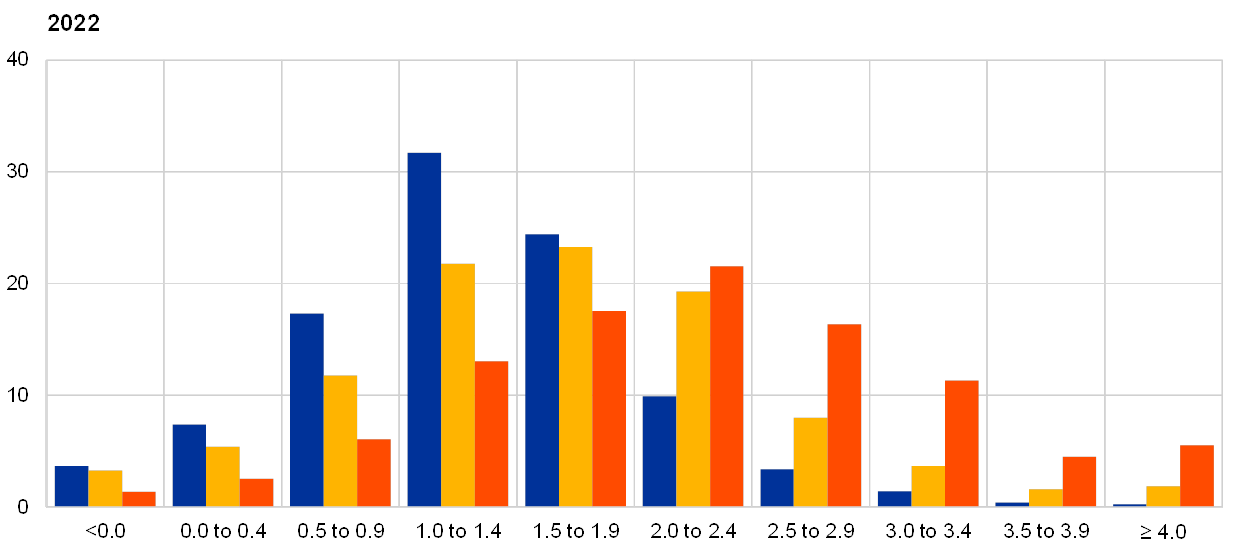
Notes: The SPF asks respondents to report their point forecasts and to separately assign probabilities to different ranges of outcomes. This chart shows the average probabilities they assigned to different ranges of real GDP growth outcomes in 2020, 2021 and 2022. In anticipation of the expected substantial revisions to the growth outlook and the considerable uncertainty surrounding them (e.g. depending on the length of the containment measures and the evolution of the spread of the virus), the SPF questionnaire was adjusted to allow for a significantly wider range of the probability distributions, with bins of 2 percentage points surrounding the regular bins of previous rounds (i.e. <-1.0% and >4.0%).
The perceived individual uncertainty has decreased somewhat for the medium term but remains high and the balance of risks is generally reported as being to the downside. The majority of respondents continued to focus on downside risks. The most cited one was the risk of a renewed spread of infections, resulting in new lockdowns. Second, a number of respondents cited the risk of a deeper and/or longer than expected weakness of consumer spending and corporate investment and a rise in insolvencies. A few respondents also saw the risk of increased political instability due to the recession. Upside risks mentioned relate mainly to an earlier than expected availability of a vaccine and to stronger than assumed multipliers of the fiscal support measures. Chart 8 and Chart 9 present the aggregate probability distributions for GDP growth for the years 2020-22 and in the longer term (2025), respectively.[4]
Chart 9
Aggregate probability distribution for longer-term GDP growth expectations
(x-axis: real GDP growth expectations, annual percentage changes; y-axis: probability, percentages)

Notes: The SPF asks respondents to report their point forecasts and to separately assign probabilities to different ranges of outcomes. This chart shows the average probabilities they assigned to different ranges of real GDP growth outcomes in the longer term.
5 Unemployment rate expectations revised in the direction of a later impact
Respondents expect a sharp increase in unemployment in 2020 and 2021 with a significant decline thereafter (see Chart 10). Participants have changed their expected profile for the unemployment rate somewhat compared with the previous round. They now expect a peak at 9.3% in 2021 and a decline thereafter, whereas in the previous round they had expected the peak at 9.4% in 2020 and a decline thereafter. Their forecast of 9.1% for 2020 represents a downward revision of 0.3 percentage points from the expectation of 9.4% in the previous round, whereas the forecast of 9.3% for 2021 is an upward revision of 0.4 percentage points. Respondents indicated that the “delayed” peak in unemployment reflects the extension of special measures providing temporary protection against unemployment, but that once these measures are phased out there will be an increase in the rate of unemployment. After peaking in 2021, the unemployment rate is expected to decline and the average longer-term forecast (for 2025) at 7.7% is unchanged from the previous round (7.7% for 2024).
Chart 10
Expectations for the unemployment rate
(percentages of the labour force)

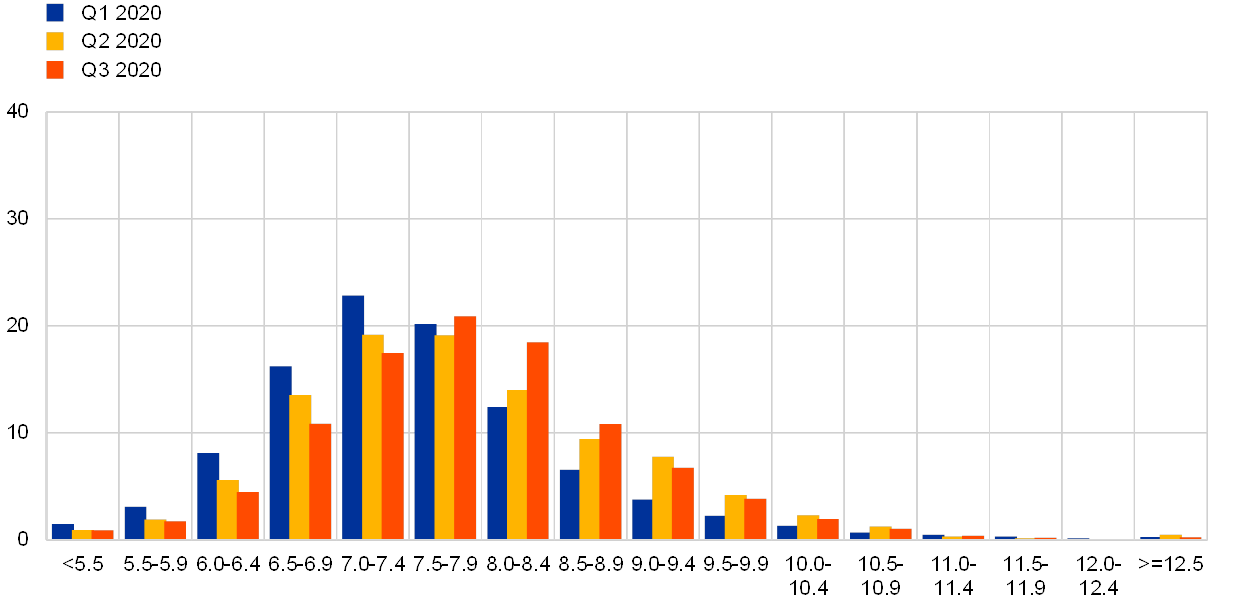
Uncertainty surrounding unemployment rate expectations, particularly for nearer-term horizons, remains at historical highs and risks are viewed to be on the upside. Forecasters’ uncertainty about the unemployment rate in the future (as measured by the average width or standard deviations of the reported probability distributions) stayed around the historically high levels observed across all horizons in the previous round (see Chart 11 and Chart 12). Indeed, for the nearer-term horizon they increased further, with uncertainty about the one-year-ahead rate still higher than that about the two-year-ahead rate. This unusual situation primarily reflects participants’ uncertainty about the impact of the coronavirus on the macroeconomy and about the impact of special protection schemes. Across all horizons, the probability distributions are skewed towards higher unemployment rate outcomes and the balance of risks is perceived to be to the upside.
Chart 11
Aggregate probability distributions for the unemployment rate in 2020, 2021 and 2022
(x-axis: unemployment rate expectations, percentages of the labour force; y-axis: probability, percentages)


Notes: The SPF asks respondents to report their point forecasts and to separately assign probabilities to different ranges of outcomes. This chart shows the average probabilities they assigned to different ranges of unemployment rate outcomes for 2020, 2021 and 2022.
Chart 12
Aggregate probability distribution for the unemployment rate in the longer term
(x-axis: unemployment rate expectations, percentages of the labour force; y-axis: probability, percentages)
Notes: The SPF asks respondents to report their point forecasts and to separately assign probabilities to different ranges of outcomes. This chart shows the average probabilities they assigned to different ranges of unemployment rate outcomes in the longer term.
6 Expectations for other variables
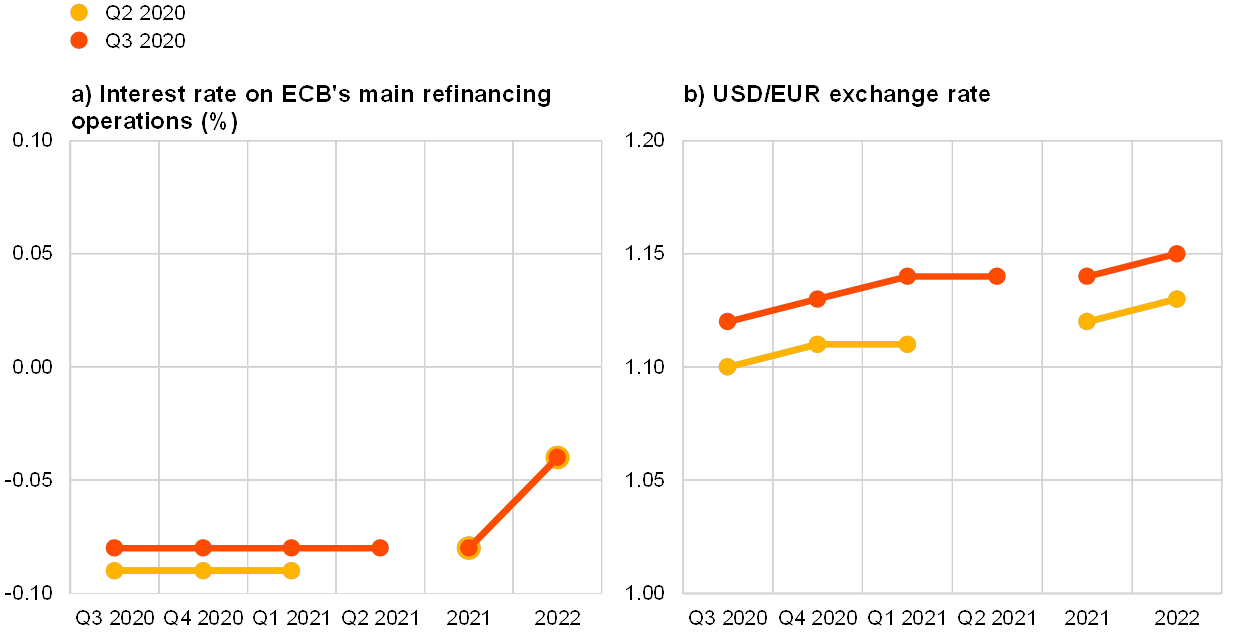
Respondents expected: (i) oil prices to increase steadily from around USD 40 per barrel in the third quarter of 2020 to just above USD 50 per barrel by 2022; (ii) the euro to appreciate slowly against the US dollar until 2022; (iii) the ECB’s main policy rates to remain low until at least 2022; and (iv) nominal wage growth to be in the range 1.1-2.0% over the entire forecast horizon.
The median expectation for the rate on the ECB’s main refinancing operations was for it to remain at 0% at least until 2022. As a small number (around 15%) of respondents reported expectations of negative rates, the average (mean) expectation is slightly negative. Overall, rate expectations are essentially unchanged from the previous round (see panel (a) of Chart 13).
The average USD/EUR exchange rate was expected to appreciate marginally from around 1.12 in the third quarter of 2020, to 1.14 in 2021 and further to 1.15 in 2022. This is slightly higher (by about 2%) than in the previous round (see panel (b) of Chart 13).
Compared with the previous round, the level of expected US dollar-denominated oil prices (per barrel) is higher over the entire horizon (the third quarter of 2020 to 2022) but to a gradually diminishing degree (see panel (c) of Chart 13). Oil price expectations for the third quarter of 2020, at USD 40 per barrel, are 14% higher than reported in the previous round. Thereafter they are expected to increase steadily to reach slightly above USD 50 by 2022, which is 3% higher than previously reported. Given the relatively limited changes to expectations for the USD/EUR exchange rate, this implies a similar relative profile for the oil price in euro. In terms of revisions to oil prices in euro from the previous round, they also ease from an upward revision of 14% in the third quarter of 2020 to 1% by 2022.
On average, expected annual growth in compensation per employee was in the range 1.1-1.7% over the period 2020-22. This is 0.2-0.5 percentage points lower when compared with the Q2 2020 survey. For 2025, it is expected to be 2.0%, 0.1 percentage points lower than in the previous round (expectation for 2024) – see panel (d) of Chart 13.
Chart 13
Expectations for other variables

7 Annex (chart data)
Excel data for all charts can be downloaded here.
© European Central Bank, 2020
Postal address 60640 Frankfurt am Main, Germany
Telephone +49 69 1344 0
Website www.ecb.europa.eu
All rights reserved. Reproduction for educational and non-commercial purposes is permitted provided that the source is acknowledged.
For specific terminology please refer to the ECB glossary (available in English only).
PDF ISSN 2363-3670, QB-BR-20-003-EN-N
HTML ISSN 2363-3670, QB-BR-20-003-EN-Q
- The survey was conducted between 30 June and 6 July 2020 with 59 responses received. Participants were provided with a common set of the latest available data for annual HICP inflation (June 2020 flash estimates: overall inflation, 0.3%; underlying inflation, 0.8%), annual GDP growth (Q1 2020: -3.1%) and unemployment (May 2020: 7.4%).
- The width of the reported probability distributions indicates the perceived degree of uncertainty, whereas the asymmetry of the distributions indicates whether that uncertainty is more concentrated on higher or lower outturns, i.e. it measures the perceived balance of risks.
- Regarding uncertainty, it can be shown that the width (or standard deviation) of the aggregate probability distribution (i.e. “aggregate uncertainty”) is a function of the average width (or standard deviations) of the individual probability distribution (i.e. “individual uncertainty”) and standard deviation of the individual point forecasts (i.e. “disagreement”).
- In anticipation of the expected substantial revisions to the growth outlook and the considerable uncertainty surrounding them (e.g. depending on the length of the containment measures and the evolution of the spread of the virus), the SPF questionnaire was adjusted at the time of the Q2 2020 round to allow for a significantly wider range of the probability distributions, with bins of 2 percentage points surrounding the regular bins of previous rounds.
-
17 July 2020


