The impact of supply bottlenecks on trade
Published as part of the ECB Economic Bulletin, Issue 6/2021.
Shipping disruptions and input shortages are leading to considerable bottlenecks in global supply chains. During the recovery phase of the coronavirus (COVID-19) pandemic, households increased their purchases of certain products, such as electronics and home improvement equipment, which caused a stronger-than-expected surge in demand, especially in some sectors. This rise in demand coupled with events beyond the reasonable control of suppliers (owing to force majeure), such as coronavirus outbreaks in ports, accidents at plants and adverse weather conditions, led to bottlenecks in the transport sector and caused shortages in specific inputs such as plastics, metals, lumber and semiconductors.[1] As inventories fell at the onset of the pandemic owing to the running-down of stocks and shortages of inputs resulting from closures and conservative inventory policies, companies struggled to keep up with the swift rise in demand and the replenishing of depleted stocks. This demand and supply imbalance is evidenced by the unprecedented lengthening of suppliers’ delivery times, especially in sectors relying on transportation and inputs from sectors experiencing shortages, namely computer and electronic equipment, machinery and equipment, wood products, motor vehicles and chemicals. Overall, in June the global PMI suppliers’ delivery times index dropped to an all-time low (meaning longer delivery times) since records began in 1999.
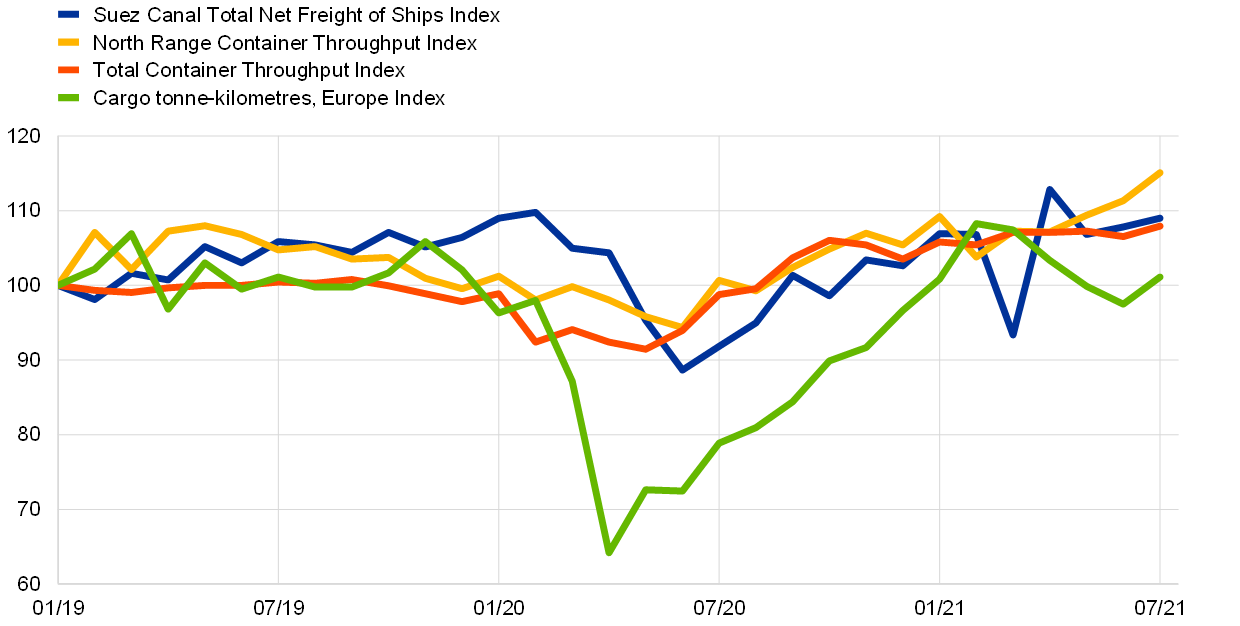
Shipping volumes have recovered since the trough in mid-2020 (Chart A). In the first half of 2021, temporary disruptions, such as the Suez Canal incident in March, led to severe strains in global shipping but did not halt the positive growth dynamics, as reflected in the global (total) and European North Range ports’ throughput indicators. European air cargo traffic was more severely affected by the pandemic as a result of the unprecedented reduction in passenger flights, which decreased cargo capacity.[2] However, by the start of 2021 air cargo traffic had once again reached its pre-crisis level thanks to firms partly switching from sea freight to air transport.
Chart A
Shipping and air cargo volumes
(seasonally adjusted indices: January 2019 = 100)

Sources: Suez Canal Authority, RWI/ISL, IATA and ECB staff calculations.
Note: The latest observations are for July 2021.
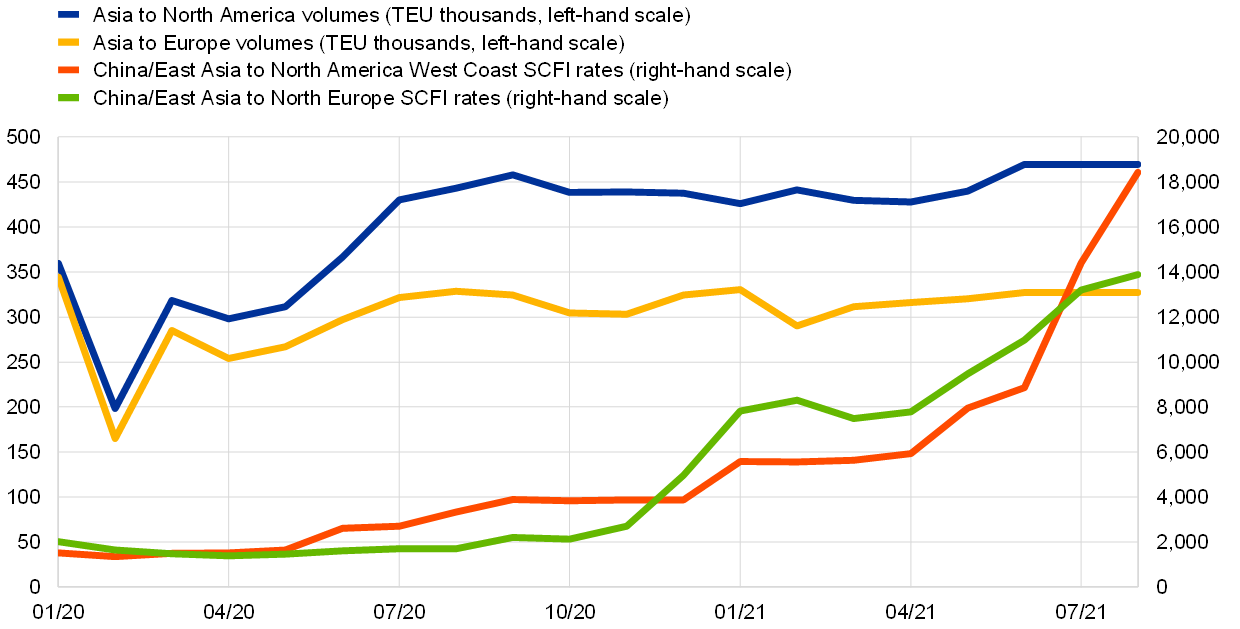
The shipping routes experiencing the most severe strains are those from Asia to North America and from Asia to Europe (Chart B), leading to extraordinary increases in shipping costs.[3] Shipping capacities on the Asia to North America route rebounded more strongly from the pandemic than on the Asia to Europe route, partly on account of increased capacity driven by the robust recovery pattern observed in the United States. Given the relatively inelastic supply of shipping capacity and disruptions in the transport sector, spot (short-term) container freight rates for Asian outbound routes have soared to record levels, particularly for routes to North America.[4] This has also led to a redirection of capacity towards this more lucrative route at the expense of other routes.[5] The shipping business relies mainly on fixed long-term contracts. In the current environment, the negotiation of new long-term contracts has probably been affected, resulting in a remarkable, albeit less strong, increase in freight rates for long-term contracts than for contracts based on spot rates.[6]
Chart B
Shipping capacities and freight rates
(weekly cargo capacity in TEU and spot freight rates in USD)

Sources: CTS, Bloomberg, Freightos and ECB staff calculations.
Notes: “TEU” stands for “twenty-foot equivalent unit of cargo capacity” and “SCFI” stands for “Shanghai Containerized Freight Index”. The latest observations are for August 2021.
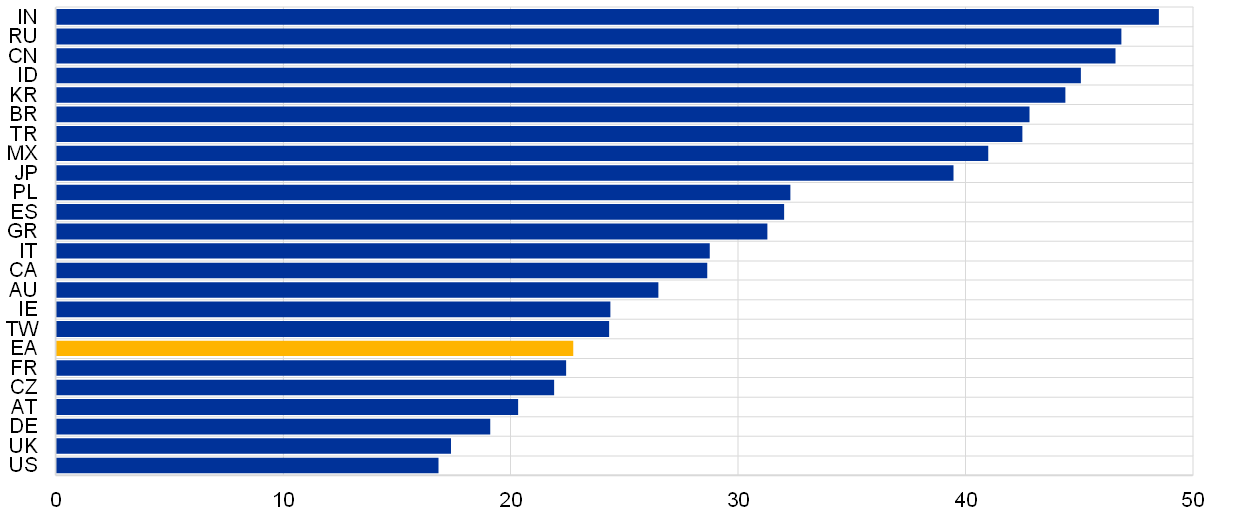
Euro area and EU countries are among those countries most affected by the shipping and input-related bottlenecks, as shown by the PMI suppliers’ delivery times index. Chart C shows that suppliers’ delivery times remained lengthy in almost all countries in August, with EU countries, the United States, the United Kingdom and Taiwan being particularly affected. The country ranking reflects a multitude of factors: (1) product composition tilted towards affected industries (e.g. automotive for the euro area, electronics in Taiwan); (2) strong demand conditions; (3) severity of transport and logistics issues; (4) specific adverse events, such as extreme weather conditions in some countries; (5) inventory policies (e.g. China’s stockpiling of chips and metals).
Chart C
Suppliers’ delivery times by country
(diffusion index)

Source: Markit.
Notes: The chart shows the values for August 2021. The lowest-ranked country is the country with the longest suppliers’ delivery times. “EA” stands for “euro area”.
In the euro area, export sectors that experienced the fastest recovery are facing higher supply shortages (Chart D). In particular, exports of motor vehicles, electronics and fabricated metals, which had expanded considerably up to the first quarter of 2021 compared with the first quarter of 2020, were affected by supply constraints which slowed the continued expansion of these sectors. This underlies the role played by strong demand in the lengthening of suppliers’ delivery times. The delays also extended to the machinery sector, which relies on electronic equipment and fabricated metals as inputs.
Chart D
Extra-euro area exports and suppliers’ delivery times by sector
(year-on-year percentage growth in values, PMI diffusion index)

Sources: Eurostat, Markit and ECB staff calculations.
Notes: A smaller value on the vertical axis indicates a longer delivery time. For exports the values are for the first quarter of 2021 and for suppliers’ delivery times the values are for May 2021. The regression line represents the relationship between the values of suppliers’ delivery times and the growth of these sectors between the first quarter of 2020 and the first quarter of 2021.
An empirical analysis utilising country-level panel data identifies and quantifies the impact of supply bottlenecks on export growth beyond the role played by demand conditions. Monthly growth rates of export volumes for a panel of 23 countries are regressed on a measure approximating bottlenecks. The PMI suppliers’ delivery times index is used to capture the extent of supply bottlenecks, and imports of intermediate inputs from sectors experiencing bottlenecks are used to measure each country’s exposure to supply disruptions. To assess the impact on export growth, the PMI index, the share of imported inputs from sectors experiencing bottlenecks and their interaction are included in a regression (with country and time fixed effects) to account for the effects of supply chain disruptions. Country-specific PMI indices of new export orders (to measure foreign demand) and lags in the dependent variable are also included.[7] Moreover, only countries whose PMI suppliers’ delivery times deviate substantially from the average level of the index are considered to be materially affected by the bottlenecks. This set-up makes it possible to verify whether the bottlenecks in imported inputs are having a negative impact on export growth. In a nutshell, a country’s exports are expected to be negatively affected by lengthy suppliers’ delivery times and this impact is expected to be magnified when the share of intermediate input imports from sectors experiencing bottlenecks is higher.
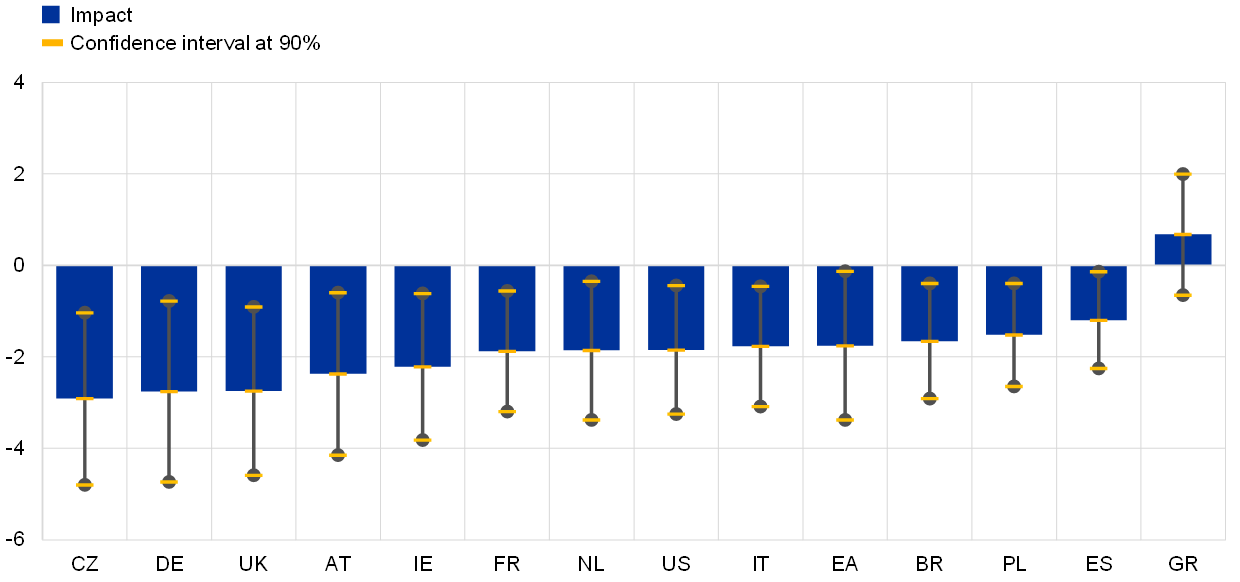
The estimates confirm that supply bottlenecks have negatively affected goods export growth, and the impact is greater for countries that have larger exposure to the sectors experiencing bottlenecks. Chart E highlights the effects of the supply bottlenecks across countries. The ranking reflects both the severity of bottlenecks (e.g. the lengthening of delivery times) and the extent of the exposure to the sectors experiencing bottlenecks. Most of the countries are in the EU, with the more adverse estimated effects being on large euro area countries and non-euro area EU countries, the latter most likely being affected by supply chain linkages in severely affected sectors (e.g. the automotive sector).
Chart E
Impact of supply bottlenecks on affected countries
(average effect on monthly goods export growth, percentage points)

Sources: CPB, Markit, Asian Development Bank multi-regional input-output tables and ECB staff calculations.
Note: “EA” stands for “euro area”.
The estimated cumulated shortfall for the level of goods exports amounts to 6.7% for the euro area and 2.3% globally. Chart F shows the counterfactual evolution of extra-euro area and world exports (excluding the euro area). According to the analysis, euro area goods exports would have been 6.7% higher if they had not been affected by supply bottlenecks. Global goods exports (excluding the euro area) would have been 2.3% higher. Although consumers have started to rebalance their purchases towards services as economies have gradually reopened, supply-side disruptions are not yet showing signs of normalising. In addition, the resurgence of COVID-19 cases in Asia is putting further pressure on shipping and cargo handling, as well as on industries already strained by supply bottlenecks, such as the semiconductor and automotive sectors.
Chart F
Estimated goods export losses
(index: January 2020 = 100)

Sources: CPB, Markit, Asian Development Bank multi-regional input-output tables and ECB staff calculations.
Note: The dotted lines show the estimated evolution of exports in the absence of supply bottlenecks.
- See the box entitled “What is driving the recent surge in shipping costs”, Economic Bulletin, Issue 3, ECB, 2021; and the box entitled “The semiconductor shortage and its implication for euro area trade, production and prices”, Economic Bulletin, Issue 4, ECB, 2021.
- Companies tried to mitigate the drop in cargo capacity by converting passenger aircraft into freighters and continued to use passenger aircraft capacity to carry cargo in cabins. Nevertheless, total available capacity fell dramatically in 2020, as evidenced by Chart B.
- The HARPEX, an index of global container shipping costs, was more or less stable at comparatively lower levels in the years running up to the outbreak of the COVID-19 pandemic. However, in the first quarter of 2021 it surged above its last peak, which dates back to the second quarter of 2005, and by the third quarter it had reached a level more than twice as high as that last peak.
- According to an econometric analysis based on a structural vector autoregressive model, the rise in shipping costs at the start of 2020 was driven by supply constraints, while the increase at the end of 2020 was due mainly to the strong recovery in global demand. For further details, see the box entitled “What is driving the recent surge in shipping costs”, Economic Bulletin, Issue 3, ECB, 2021.
- See Khasawneh, R. and Xu, M., “China-U.S. container shipping rates sail past $20,000 to record”, Reuters, August 2021.
- See Sand, P., “Container shipping: records keep falling as industry enjoys best markets ever”, BIMCO, June 2021.
- Asian Development Bank input-output tables are used to compute the share of directly and indirectly imported inputs from sectors experiencing bottlenecks in relation to total imported inputs. Sectors affected by supply disruptions are machinery, electrical and optical equipment, transport equipment, inland transport, water transport, air transport and other transport activities.


